What is a Spike in technical analysis?
What is a Spike in technical analysis? The Spike pattern is one of the most exciting patterns in technical analysis, and if you master it well, you can make significant profits. However, not recognizing it properly can be just as damaging. In general, a Spike pattern refers to a sudden jump or fall in price in a very short period of time. This extreme swing is so powerful that it can be seen as a large green or red candle on the candlestick chart. This article is supposed to answer your questions about this pattern; Stay with us.
Table of Contents
- What does the Spike pattern mean?
- Reasons for a Spike in the price chart
- How to recognize a Spike?
- How to detect a Spike with candlesticks
- How to trade with Spike
- Final Word
- Frequently Asked Questions
What does the Spike Pattern mean?
In simple words, whenever we encounter a sharp price change in a short period of time in a price trend, we say that a ” Spike ” has occurred. A Spike in technical analysis usually occurs when a shocking news is released, for example, when the important news of the US dollar is released from the economic calendar, the probability of a Spike is very high. It is possible to recognize this pattern in all types of candlestick, bar and even line charts, and for this reason, you can make significant profits by accurately identifying the start and end point of the Spike. It should be noted that there are two points of view regarding the definition of Spike in technical analysis. In the first viewpoint, all sharp and sudden movements in the market are called Spikes, but in the second viewpoint , the V-shaped movement in the price chart is called Spike.
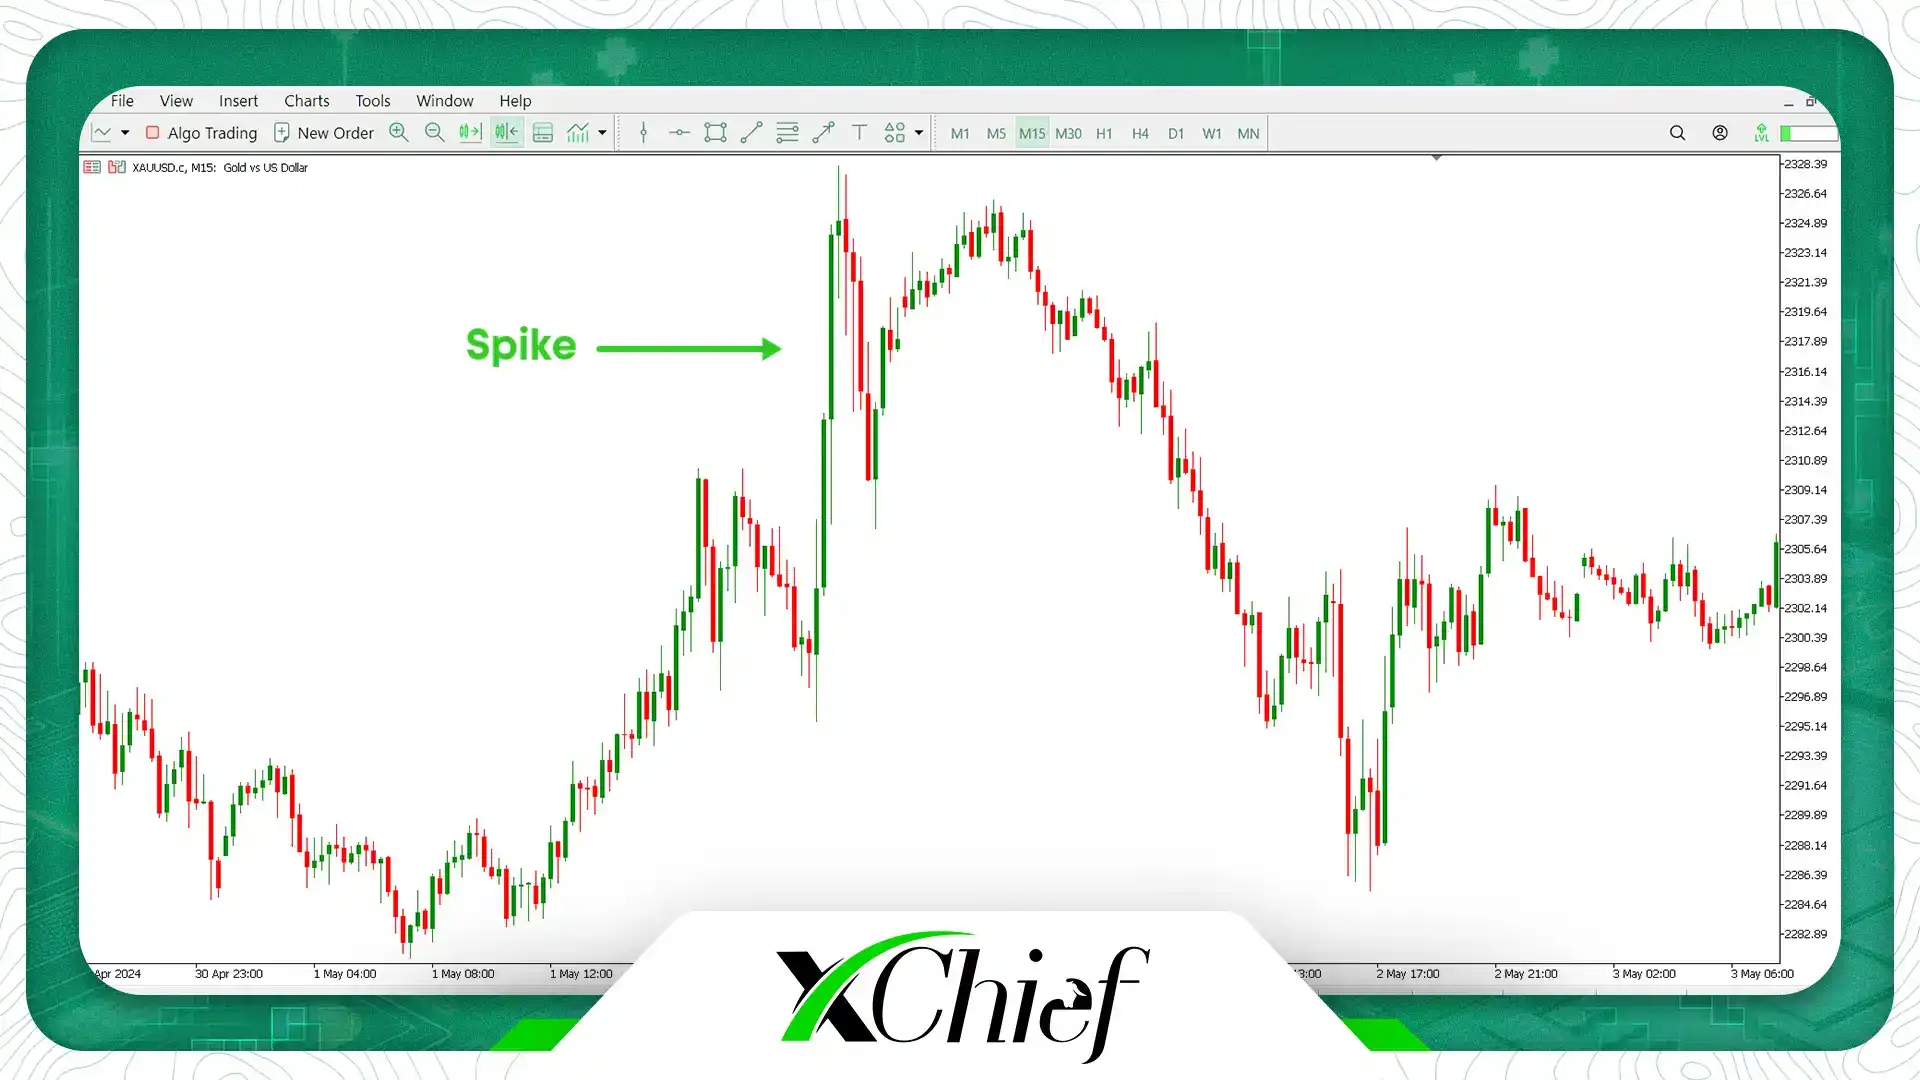
If you look at the Spike candle on candlestick charts, it usually has a long body with a small shadow. This candle occurs when the area of support or resistance levels is broken in a short time with great strength. For example, in the image below, you can see a Spike pattern of the gold symbol (XAUUSD) on the 15-minute time frame:
If we want to point to an example of a Spike in history, Black Monday in the US stock market is one of the best examples. On October 19, 1987, in a negative bounce, the Dow Jones Industrial Average (US30) fell 23% in one trading session.
The main characteristics of the Spike Pattern
Each Spike has the following 3 important features:
1. At the top of the Spike pattern (V mode) or at the bottom (at the tip of the peak or bottom point of the pattern), price volatility is not seen; Rather, only a sharp angle is created.
2. Spike is the best opportunity for huge profits; But it can be just as damaging.
3. For small time frames, the length of each Spike is about 6 to 10 pips.
Reasons for a Spike in the Price Chart
Various reasons can cause a Spike in the market, including the following:
- News events: Some news related to financial markets, such as economic reports, can cause Spikes and rapid fluctuations in the market.
- Market sentiment: The sentiment of buyers and sellers towards an asset can cause them to rush to buy or sell.
- Activity of market leaders: In some cases, market leaders create price Spikes and jumps with specific goals.
- Technical factors: sometimes, the breaking of the resistance zone or a sudden change in some indicators causes a Spike.
Do not forget that a sudden price change with a Spike may not have a long-term effect; For this reason, it is better to act carefully in identifying the Spike from the beginning and consider various influencing factors.
How to recognize a Spike?
One of the main signs of a Spike pattern is very high trading volume. This candle occurs when a large volume of an asset enters or exits the market. The sudden change in price is mostly due to the emotions of buyers and sellers. Another sign of a Spike is very tall candlesticks that form on the chart.
Definition of Spike (First Viewpoint)
In the first view, the Spike pattern is a sharp and fast movement that is made in a specific direction and starts to move in the direction of the Spike after the price. This viewpoint is mostly used in the price action style of Al Brooks. As one of the famous traders and coaches in the financial markets, Al Brooks considers market movements in a price cycle and believes that the price always moves in a three-stage cycle. According to Al Brooks, the Spike pattern in the price action trading style is one of the three stages of this price cycle. The three main phases in the Al Brooks price cycle are:
- Spike: In this phase, the price moves in a specific direction with sharp and fast movements.
- Channel: After the Spike, the price enters the channel phase due to having good momentum and strength. In this phase, the price moves upward or downward between two parallel trend lines (which have less momentum than the Spike).
- Trading Range: In this phase, the price moves horizontally and without direction and moves between two horizontal parallel levels.
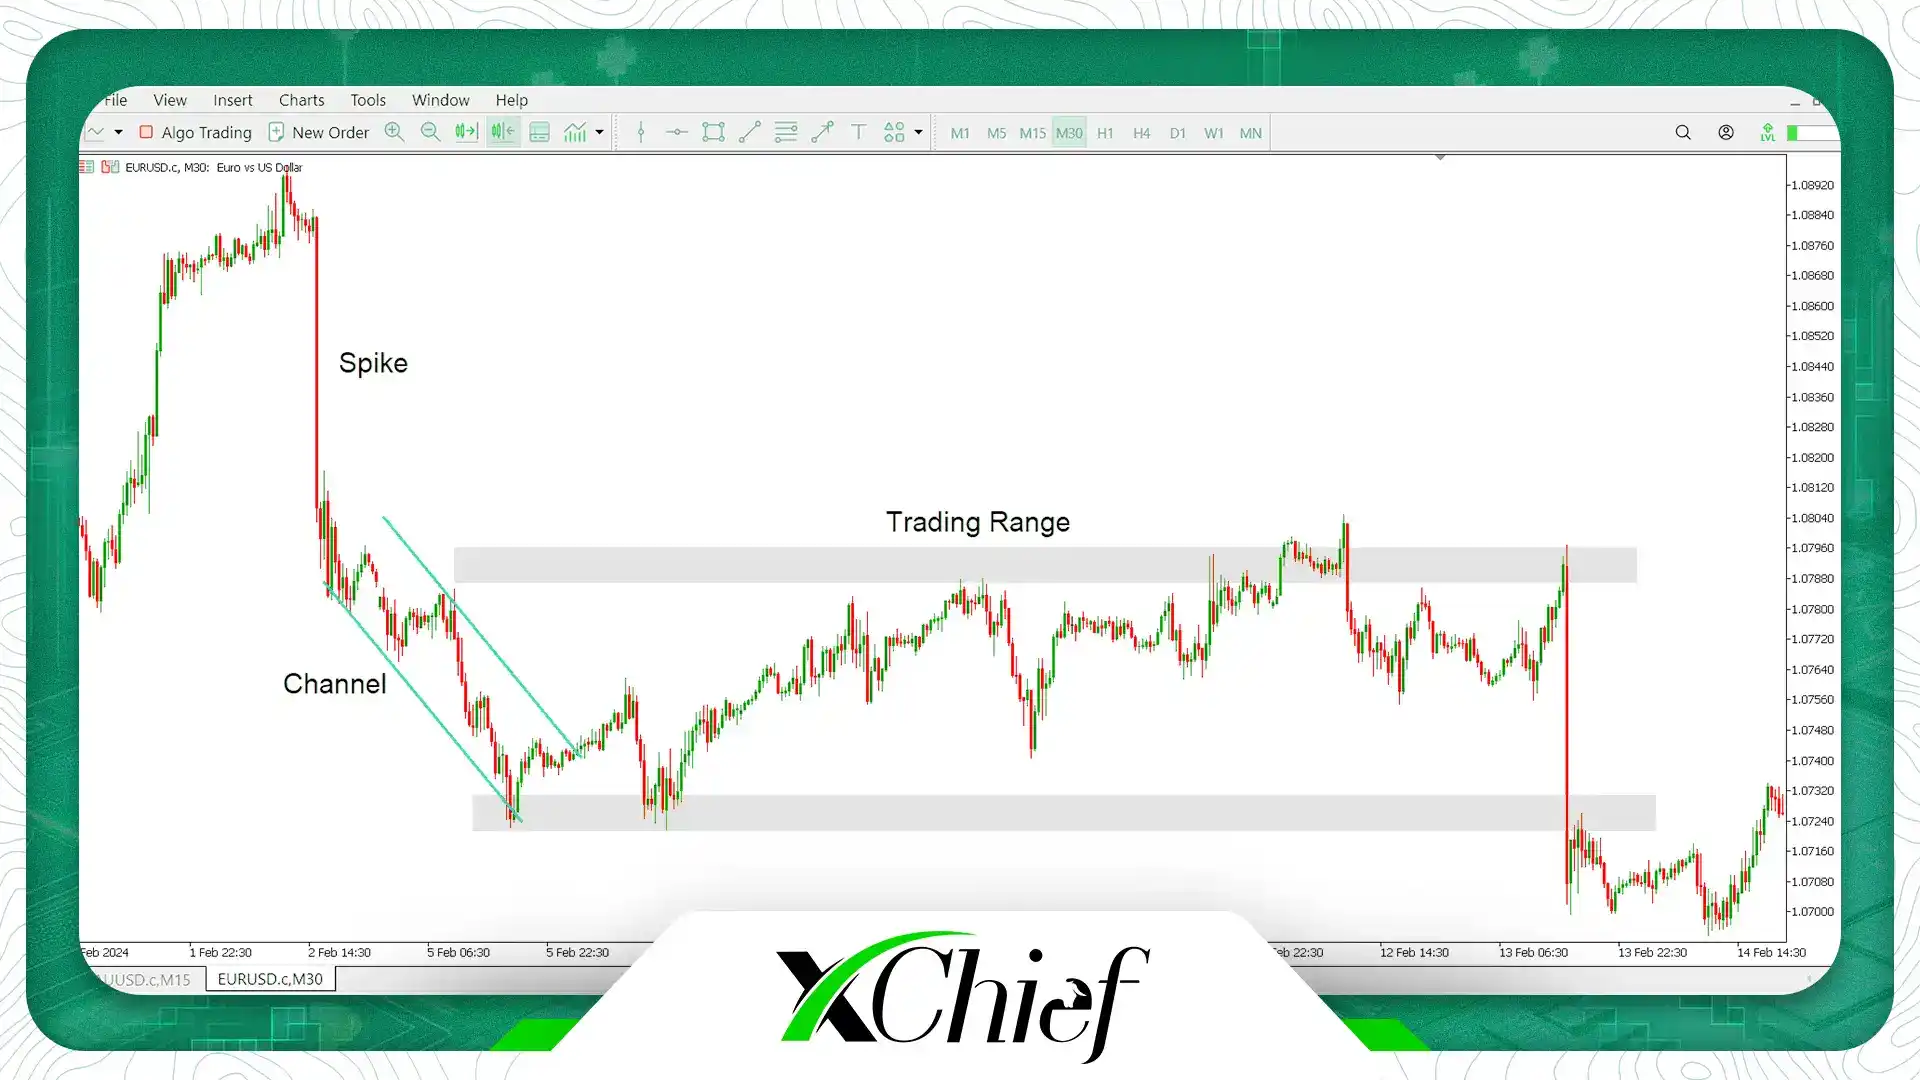
Al Brooks believes that the price enters the channel phase after a Spike movement, then the power and momentum of the price gradually decrease and the price enters the Range Trading phase. In this phase, the price moves without a specific direction between two horizontal parallel lines. This view can help traders make better decisions when entering and exiting trades. For example, in the image below, you can see a complete cycle of the Eurodollar symbol (EURUSD) in the 30-minute time frame:
Spike definition (second Viewpoint)
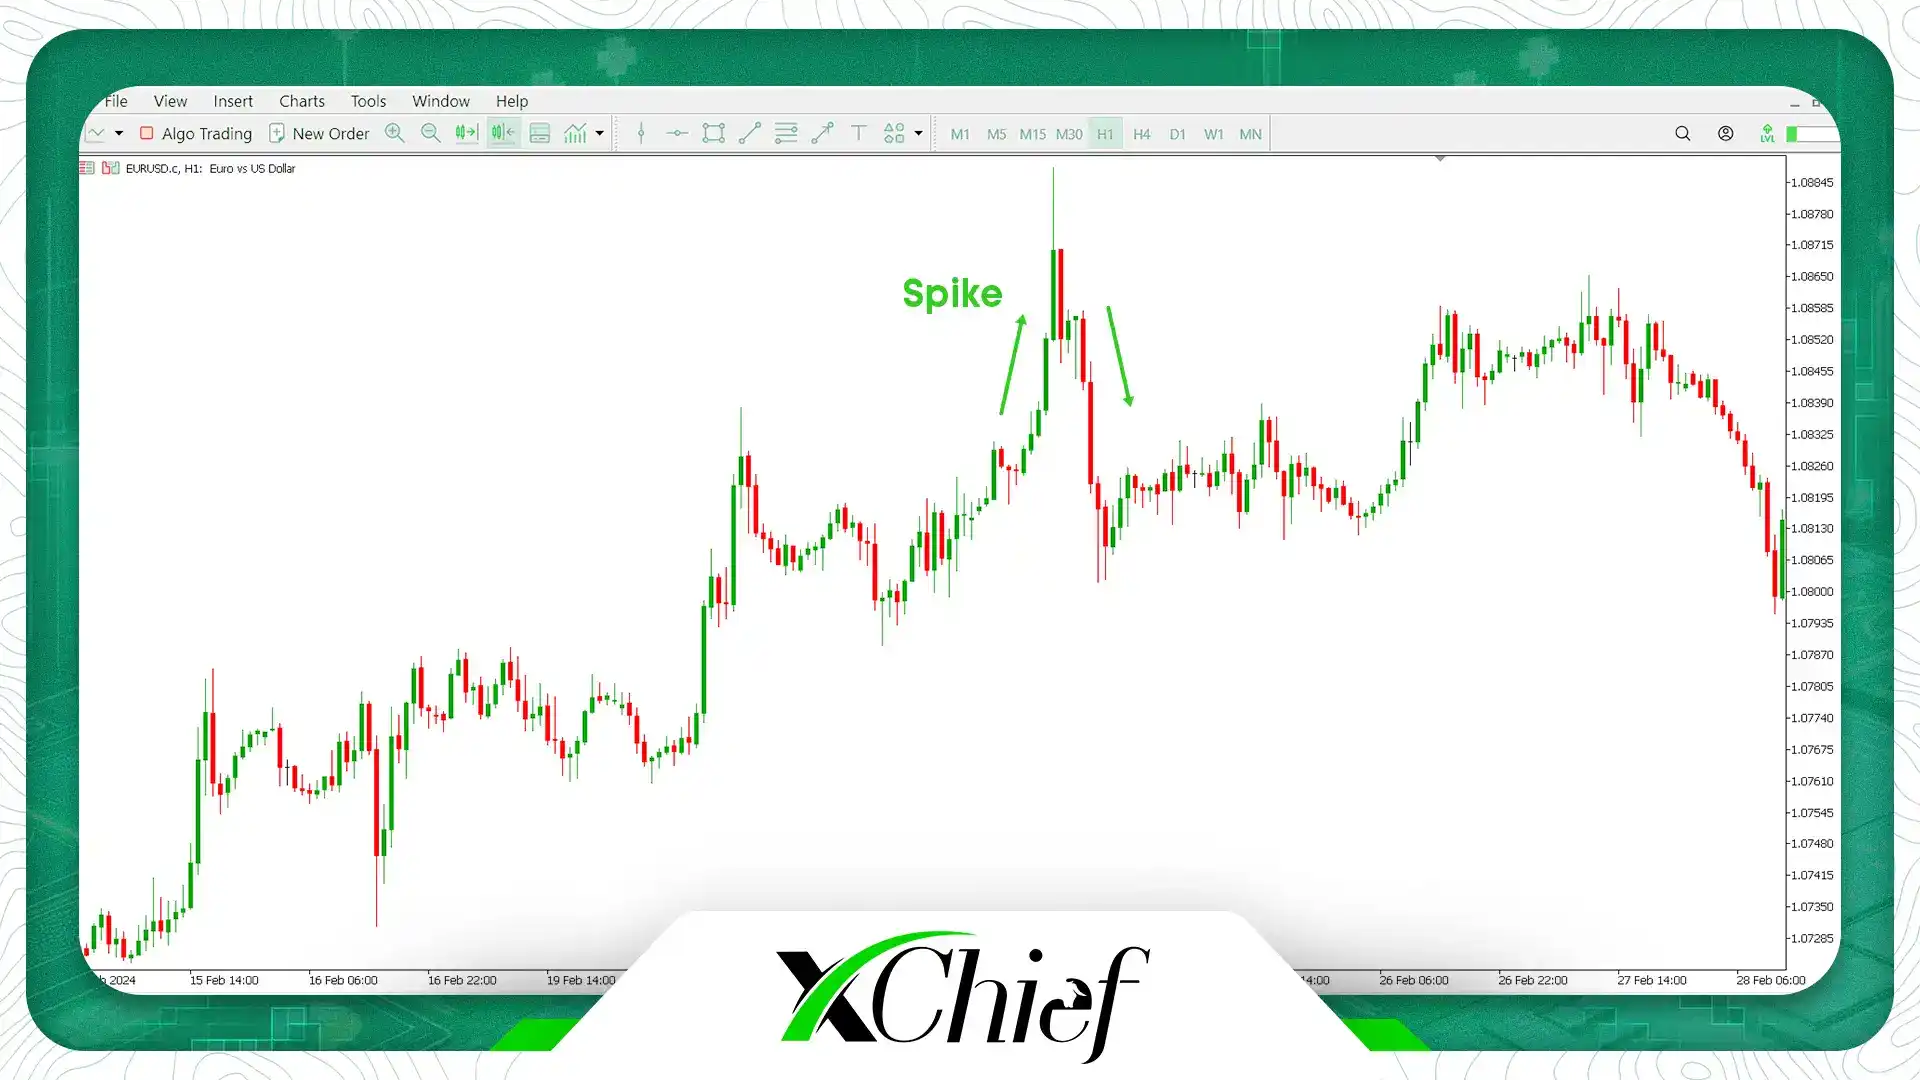
In the second view, the Spike pattern is said to be two sharp and fast movements that are created consecutively and in opposite directions. In fact, the Spike pattern in this view resembles the English letter V. This means that at the beginning of the pattern, according to the price trend of the market, it is ascending or descending; But after a short time, the market reverses again and returns all its previous movement. For example, in the image below, you can see a Spike pattern, according to the second definition, created on the one-hour timeframe of the EURUSD currency pair:
How to detect a Spike with candlesticks
If you look at the spike candle charts, the spike is seen as a large bullish or bearish candlestick. It is good to know that the spike is often part of another pattern. For example, Head and Shoulders patterns or even Double Top and Bottom patterns are among these patterns. The interesting point is that in both of these patterns, a pullback or price reversal occurs; So if for any reason you fail to spot a spike, you can keep an eye on these same patterns and take timely action to enter the trade and make a substantial profit.
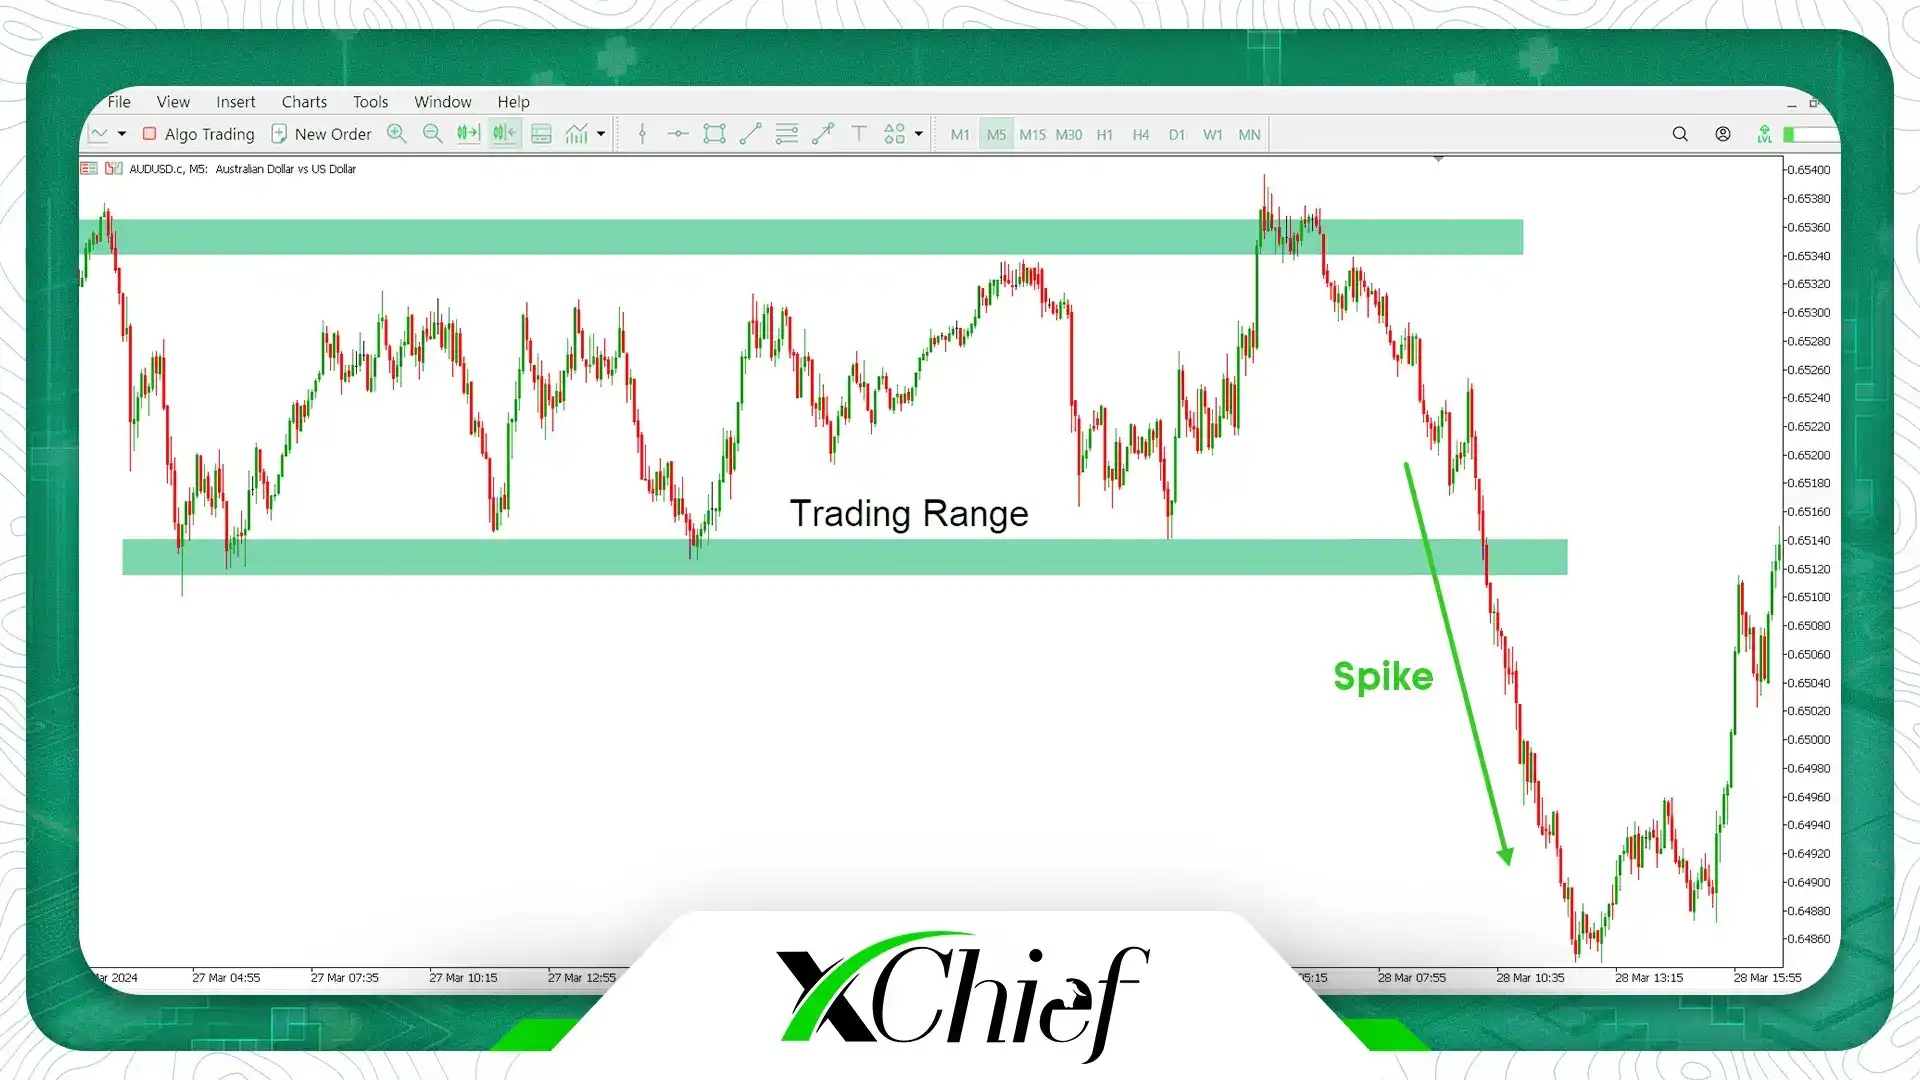
You probably have this question: how to identify the start and end point of a spike? In order to identify the starting point of the spike, you must first determine the trading range carefully. Most of the time when a trading range is broken, a spike starts. So, to begin with, first define the upper and lower limits of the trading range. Whenever these ranges are broken, a spike is most likely initiated. For example, as you can see in the example below, the price in the AUDUSD currency pair in the 5-minute timeframe was in a trading phase, which then went out of this range with a downward spike:
What is a real Spike and a fake Spike?
The terms Real Spike and Fake Spike may sound new and a bit dumb to you, but they actually do not mean anything new. In the first Viewpoint of the definition of spike, for example, if a bearish spike occurs and after that the price continues to fall, such a spike that has created a significant downward trend is called a real spike, but if A downward spike occurs, but then the price returns immediately and actually creates a (V) pattern, such a spike that fails to start a new movement is called a fake spike. In this case, the price trend returns to the previous state after a sharp jump or fall. This situation mostly happens when there is a lack of liquidity and also when an important news is published, and the price trend changes in a strange way.
How to trade with Spike
In the spike trading strategy, risk management is the first word; Because this pattern is extremely risky and always shows its price with strong movements. Therefore, to use spike, you must follow your risk management plan well and be ready for quick reaction.
For the trading strategy with this pattern, first define the profit and loss limit after identifying the entry point of the spike. For this, you need to identify the next support and resistance levels and define your profit and loss limits in those areas. After that, specify the transaction volume. Enter a position in the direction of the market trend exactly when the price of the desired asset approaches the lowest or highest point in the spike pattern. With this, you must simultaneously look at your profit and loss limits; When the price reaches the profit limit, you can exit the trading position.
Final Word
In the end, it is good to know that the Spike pattern, like any other pattern, requires sufficient knowledge and information to enter and exit the trade. Note that this pattern is largely related to market sentiment; Therefore, you should be able to analyze the trading behavior of traders and news related to the market well. Spike also needs high risk management; So if you are not yet ready to experience a significant risk, it is better not to invest in spike. Only if you have enough information about this concept, you can experience great and attractive profits. We hope this article has answered all your questions about Spike; Otherwise, if you still have questions or doubts, you can comment your questions below this article so that the experts will answer you as soon as possible.
Frequently Asked Questions
1. What is a Spike in financial markets?
A spike refers to the sudden and extreme movement of an asset’s price in a short period of time. This movement can be upward (sudden price increase) or downward (sudden price decrease).
2. What factors cause Spikes?
A number of reasons can cause a spike, including: sudden or unexpected news releases, algorithmic trading activity, and sudden selling or buying pressure.
3. How do Spikes affect the market?
Spikes can have a variety of effects, including increasing volatility, creating trading opportunities, attracting investor attention, and creating fear or greed in the market.
4. How to use Spikes in trading?
Traders can use spikes to take profits or avoid losses. However, it’s important to do your research before trading during spikes and find out why prices are going up or down. You should also use a stop loss to limit potential losses.