Technical analysis
Introduction:
What is technical analysis and what is its application? Technical analysis in the forex market is one of the widely used tools for predicting price movements based on charts and past price patterns. This approach is based on the assumption that history tends to repeat itself and markets follow specific price patterns. Technical analysts study and analyze price behavior using various tools and technical indicators.
Technical analysis is one of the two main “branches” of analysis in financial markets, which is used by Forex market operators. In contrast to fundamental analysis, which studies economic, financial and other external factors that can affect currency prices, technical analysis focuses on price charts and volume of transactions and tries to predict the future behavior of the market based on historical patterns. Predict in these charts.
The foundation of technical analysis is based on three main principles: first, that all information available in the market is reflected in prices; Second, prices tend to move according to trends; And thirdly, history usually repeats itself. Technical analysts use these principles to examine price charts to identify profitable trading positions.
Examining past price patterns and charts gives analysts the opportunity to spot patterns and trends that are likely to repeat themselves in the future. Although technical analysis mainly seeks to identify market conditions, it can also be used to identify when the market may be overbought or oversold.
In technical analysis, which focuses on the price chart, it allows traders to make decisions regardless of complex external factors, such as economic reports or political news. They believe that all market-related information, including traders’ concerns, hopes and fears, is reflected in spot prices as well as trading volumes. This approach avoids valuation and analytical complexities and instead focuses on the internal dynamics of the market itself.
This strategy is very popular in the forex trading community because the forex market has strong technical characteristics that are well suited to technical analysis tools and patterns. Technical traders can use different timeframes to base short, medium or long term trades.
Technical analysis also has the advantage of flexibility, meaning that it can be applied to almost any financial instrument and market that has a price chart. This makes technical analysis known as one of the most central tools in all types of forex trading. In this article, we have tried to describe technical analysis in simple language with several technical analysis tools such as types of triangles in technical analysis, technical analysis patterns, types of technical analysis methods and the best technical analysis method as well as technical analysis tools.
What does technical analysis include:
- *Charts*: The main tool of technical analysis is the price chart. Bar charts, candlesticks and line charts are among the most widely used types of charts in technical analysis.
- *Trends*: Analysts seek to identify prevailing trends in the market. If we want to have a simple description of the types of trends, an uptrend occurs when prices consistently make higher peaks and valleys. Conversely, in a downtrend, prices produce lower floors and ceilings.
- *Support and Resistance*: Support and resistance levels are points on the chart where the price tends to receive resistance or support from moving beyond them. Breaking these levels can mean a trend change.
- *Chart Patterns*: Common patterns such as heads and shoulders, triangles, flags, and balloons that can indicate a continuation or reversal of the current trend.
- *Technical Indicators*: Tools like moving averages, RSI (Relative Strength Index), MACD (Moving Average Convergence/Divergence), and Bollinger Bands that help investors make decisions based on more detailed analysis.
- *Volume*: Trading volume analysis can also serve as a confirmation of the strength of a trend or pattern.
- *Risk management*: Applying Stop-Loss and Take-Profit orders is an integral part of trading strategies based on technical analysis.
How to use technical analysis?
- *Learning and Practice*: Before starting, it is important to understand the basic concepts and work with various charts and tools.
- *Using a demo account*: Practicing on the real market using demo accounts will help you develop your technical analysis skills without the risk of losing capital.
- *Strategy Development*: Developing a trading plan based on specific entry and exit rules that includes risk management and your personal risk tolerance.
- *Continuous Analysis*: Technical analysis requires continuous market review and adjustment of strategies based on changing market conditions.
- *Flexibility*: The ability to adapt to new conditions and change strategies when markets change is important.
Technical analysis can be a powerful tool, but keep in mind that it is not accurate or definitive. It is recommended to use technical analysis as part of a comprehensive trading strategy, in which other factors such as fundamental analysis, macroeconomics and daily news are also considered.
Triangle patterns in technical analysis
In technical analysis, it is these patterns that help the analyst to recognize trends and predict future results, and lead him to profitable and low-risk transactions. One of the most widely used patterns in technical analysis is the triangle pattern, which is a subset of the classic patterns (such as the flag pattern). These patterns mostly promise the continuation of the trend, but sometimes also warn the analyst of the reversal of the trend.
Triangle patterns are divided into three main categories:
1. symmetrical triangle
2. Incremental triangle
3. Decreasing triangle
Support and resistance in the triangle pattern
In a triangle pattern, the bottom line of the triangle is known as the support line. In this area, the buyers have more power than the sellers of shares and the price of shares increases due to the greater demand of buyers than the supply of sellers. By approaching the upper line of the triangle, which is also called the resistance line, the opposite of the previous situation happens, and this time, the sellers have more power than the buyers and the price decreases.
Next, we will examine the three main categories of triangle patterns mentioned above:
Symmetrical triangle pattern
In this pattern, the upper and lower lines of the triangle move towards each other at the same time, which shows the almost equal strength of buyers and sellers. In this pattern, the continuation of the price trend does not have a specific situation and it may move in the continuation of the previous trend or in the opposite direction of the previous trend and it depends on which price breaks the triangle line.
The closer the upper and lower lines of the triangle get closer to each other, the more likely the lines will be broken, but until the lines are broken by a price candle and a candle is created to confirm the break of the triangle, you should not start trading.
To draw the upper and lower lines of the triangle patterns, we need at least two to three points for each line so that our pattern is reliable, keep in mind that the drawing of these patterns depends to some extent on the analyst’s taste and the pattern drawn by Different analysts have differences with each other, which is not very important and depends on his taste and experience in technical analysis.
Incremental triangle pattern
In this pattern, the upper line of the triangle or the resistance line is almost horizontal, and the lower line moves towards the upper line with the passage of time. In this pattern, we see a gradual increase in the power of buyers, but this power is not enough to push the price beyond the upper line.
The trend in continuation of this pattern is usually upward. So, if this pattern is formed in the continuation of an upward trend, it is a continuation pattern and if it is formed in the continuation of a downward trend, it is a return pattern.
We make purchases using this pattern when the upper line is broken by increasing the power of buyers and this failure is accompanied by an increase in the volume of transactions. Because the guarantee of breaking a resistance and starting an upward movement in the price is to increase the trading volume.
Incremental triangle pattern
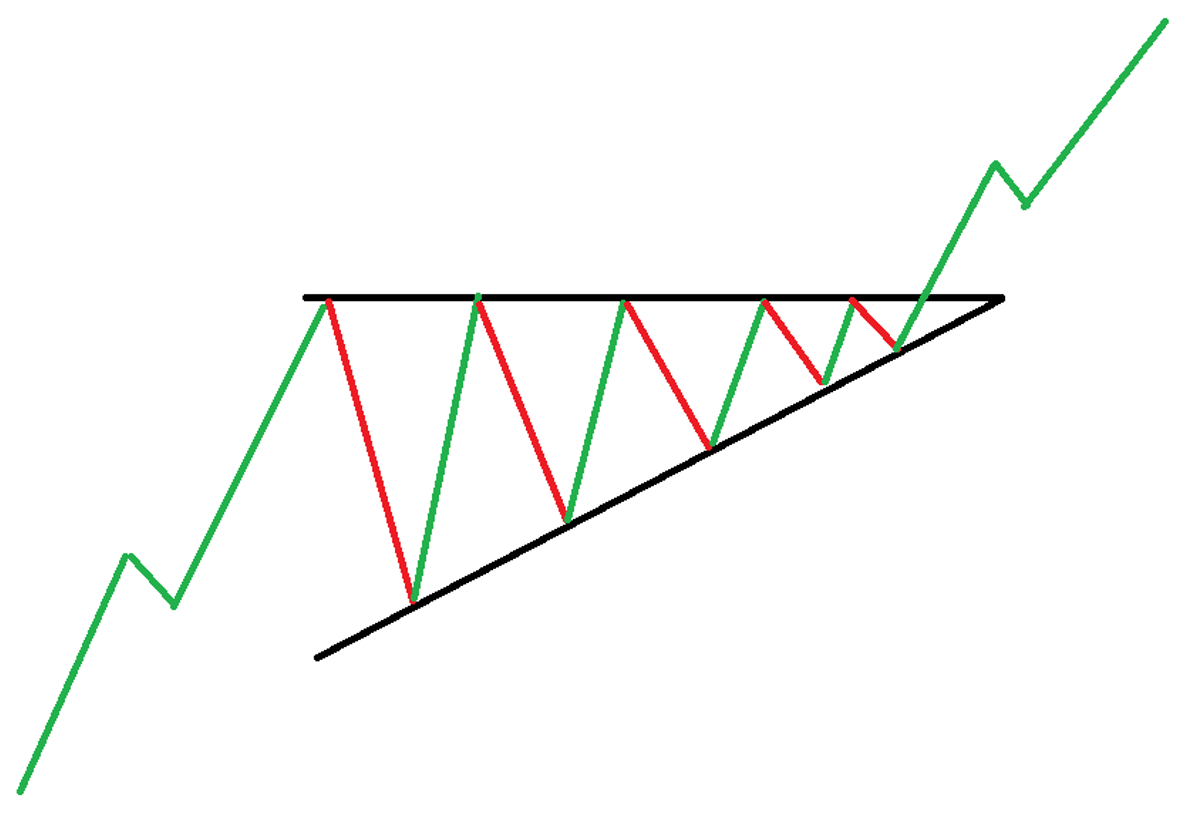
Incremental triangle pattern
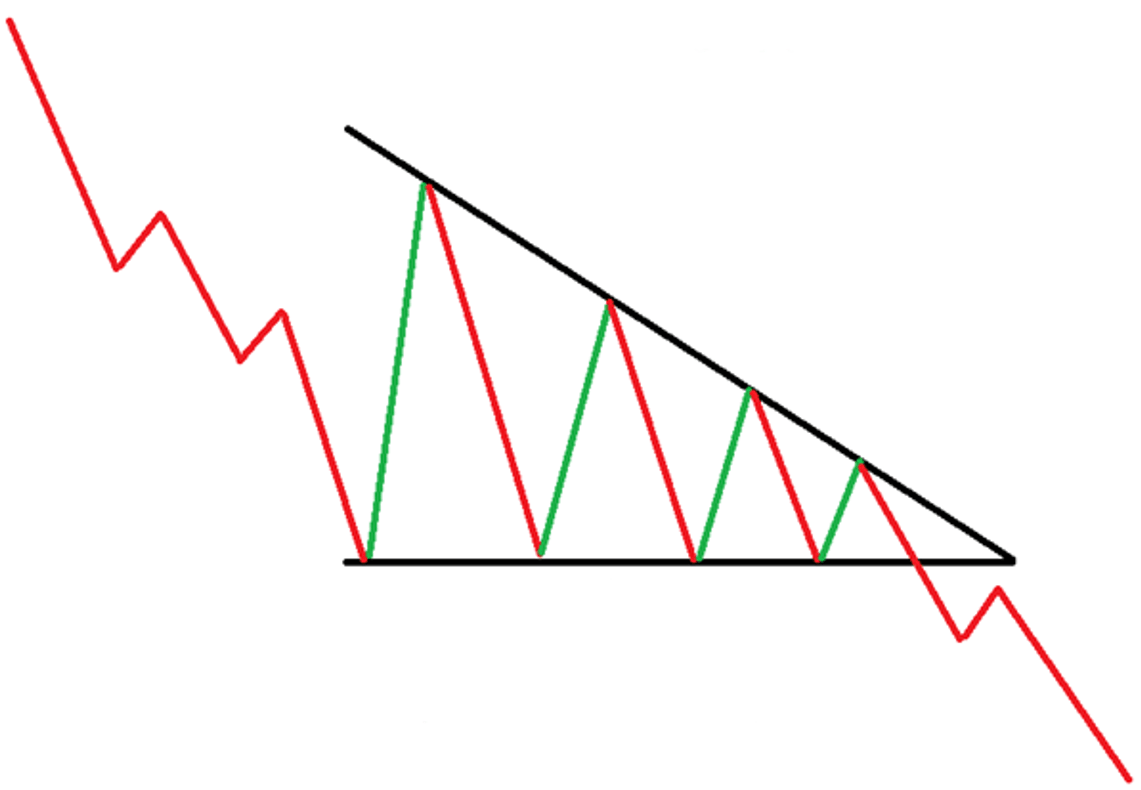
The descending triangle pattern
This pattern is exactly the opposite of the rising pattern, and this time it is the upper line or resistance that moves towards the support line, which is almost horizontal. This triangle is usually formed in the continuation of a downward trend, and this downward trend continues after the triangle is broken.
Paying attention to the volume of transactions is also very important in the failure of the descending triangle. Because the volume of transactions usually decreases when the price is inside the pattern as the top and bottom of the pattern approach each other, and an increase in the volume of transactions can be a reliable sign of the triangle breaking.
Triangular patterns are very widely used and can be seen in abundance on price charts, no matter what trading chart it is on. It can be seen in currency pairs, in gold, oil and even in cryptocurrencies. These patterns are known as medium-term trading patterns and are useful for trading in this time frame. However, it should be noted that these patterns, like other analytical patterns and methods, cannot be relied on alone, and for profitable and low-risk trading, it is better to use a set of analyzes according to our strategy.
What is the price trend in triangle patterns?
In general, if a triangle pattern is formed in the trading chart, usually (not necessarily), the price tends to follow its previous path again after consolidating in the triangle pattern. Usually, before the release of important economic news, traders take some of the profits. They reserve themselves and do not want to enter a new trade until the news is released and again the traders enter the buy or sell trade. But in the triangle pattern, such movements of the price can be seen that if the price leaves the ceiling at the end of the triangle, it will be bullish and if the price leaves the bottom of the end of the triangle, we will have a fall in price. But the important thing is where the triangle was formed in the price and also at what time it was formed. Trading is usually based on technical analysis in 15 minutes and above to daily, and the triangles formed in low times can show weaker performance than high times.
Types of technical analysis methods:
In the technical trading style, indicators are also used because the indicators are actually a confirmation of the analysis, and be careful that the indicators are always formed based on the past behavior of the market, for example, in the indicator with a period of 14, that is, from It calculates the current candle up to the last 14 candles, the opening values, the minimum and maximum value, and the closing value of each candle and displays it as a graph or histogram in the figure.
But there are a series of volume indicators that can be accessed with level 2 data, and these indicators can show the volume of transactions at the same moment to the trader, or the purchase and sale values of the formed queues, etc. can be seen These indicators are used for trading and cannot be used for technical analysis. Because technical analysis displays a path for the future price in high times, but the current volumes are used for transactions in low times and price fluctuations. So, in this topic, we came to understand the performance of these two types of indicators.
Should indicators be used for technical analysis?
In answer to this question, we can say “no” with certainty. The use of indicators is actually to confirm the analysis and analysis can be done without them.
The patterns that are formed based on the price in the trading chart can be used without any indicator. These patterns are like: triangle patterns (which we discussed above) or soroshaneh, which we will mention below.
“Head and Shoulders” or “Kings Crown” patterns and other price action patterns.
Sorusha pattern:
The head and shoulders pattern is one of the most classic and well-known chart patterns in technical analysis and is used to predict trend reversals. This pattern is seen in two forms: reversal (indicating a reversal of an uptrend to a downtrend) and normal (indicating a reversal of a downtrend into an uptrend).
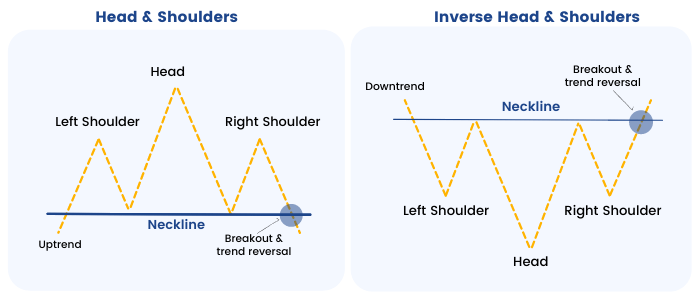
noisy pattern
Head and Shoulders pattern:
This pattern consists of three peaks in a price chart, which is explained as follows:
*Left Shoulder*: After an uptrend, the market forms a peak or ceiling and then returns to a lower level.
*Head*: The market rises again, but this time to a level higher than the left shoulder, and then returns to around the previous level.
– *Right Shoulder*: Finally, the market increases once again, but only to a level similar to the left shoulder and decreases again.
At a point between the shoulders and the head, a horizontal or oblique line can be drawn, which is known as the “Neckline”. Breaking and closing the price below the neckline of the pattern is a signal for the occurrence of a trend reversal and the beginning of a downward movement.
Inverse Head and Shoulders pattern:
This pattern is the reverse version of the standard head and shoulders pattern and indicates the end of a downtrend and the beginning of an uptrend. In this pattern, the left shoulder and head are formed at the lowest price points, and the right shoulder is formed on the same level as the left shoulder. The “neckline” in this pattern also works similarly to the standard pattern, but instead of its breaking being bearish, the breaking of the neckline here is bullish and indicates a reversal of the trend.
Important points of the head and shoulders pattern:
– *Pattern Confirmation*: The pattern is confirmed only after the price breaks and closes below or above the neckline.
– *Trading Volume*: The volume should be at the highest level when the head is formed and decrease when the right shoulder is formed, and when the neckline is broken, an increase in trading volume is usually observed.
– *Price Target*: Most traders expect a price target after a breakout using the height of the pattern from the neckline to the head.
This pattern is used in all financial markets and can occur in different time frames such as minute, daily, weekly and even yearly. Correct recognition and proper application of this pattern can contribute to an effective trading strategy. There are different types of patterns in technical analysis, which we mentioned the most important ones.
How to analyze a stock technically?
Another technical analysis pattern is called “Double Touch” pattern, with this pattern we want to check a share:
Here we give an example from the Tehran Stock Exchange. Siman Tamin Investment Company with the symbol “Sita”
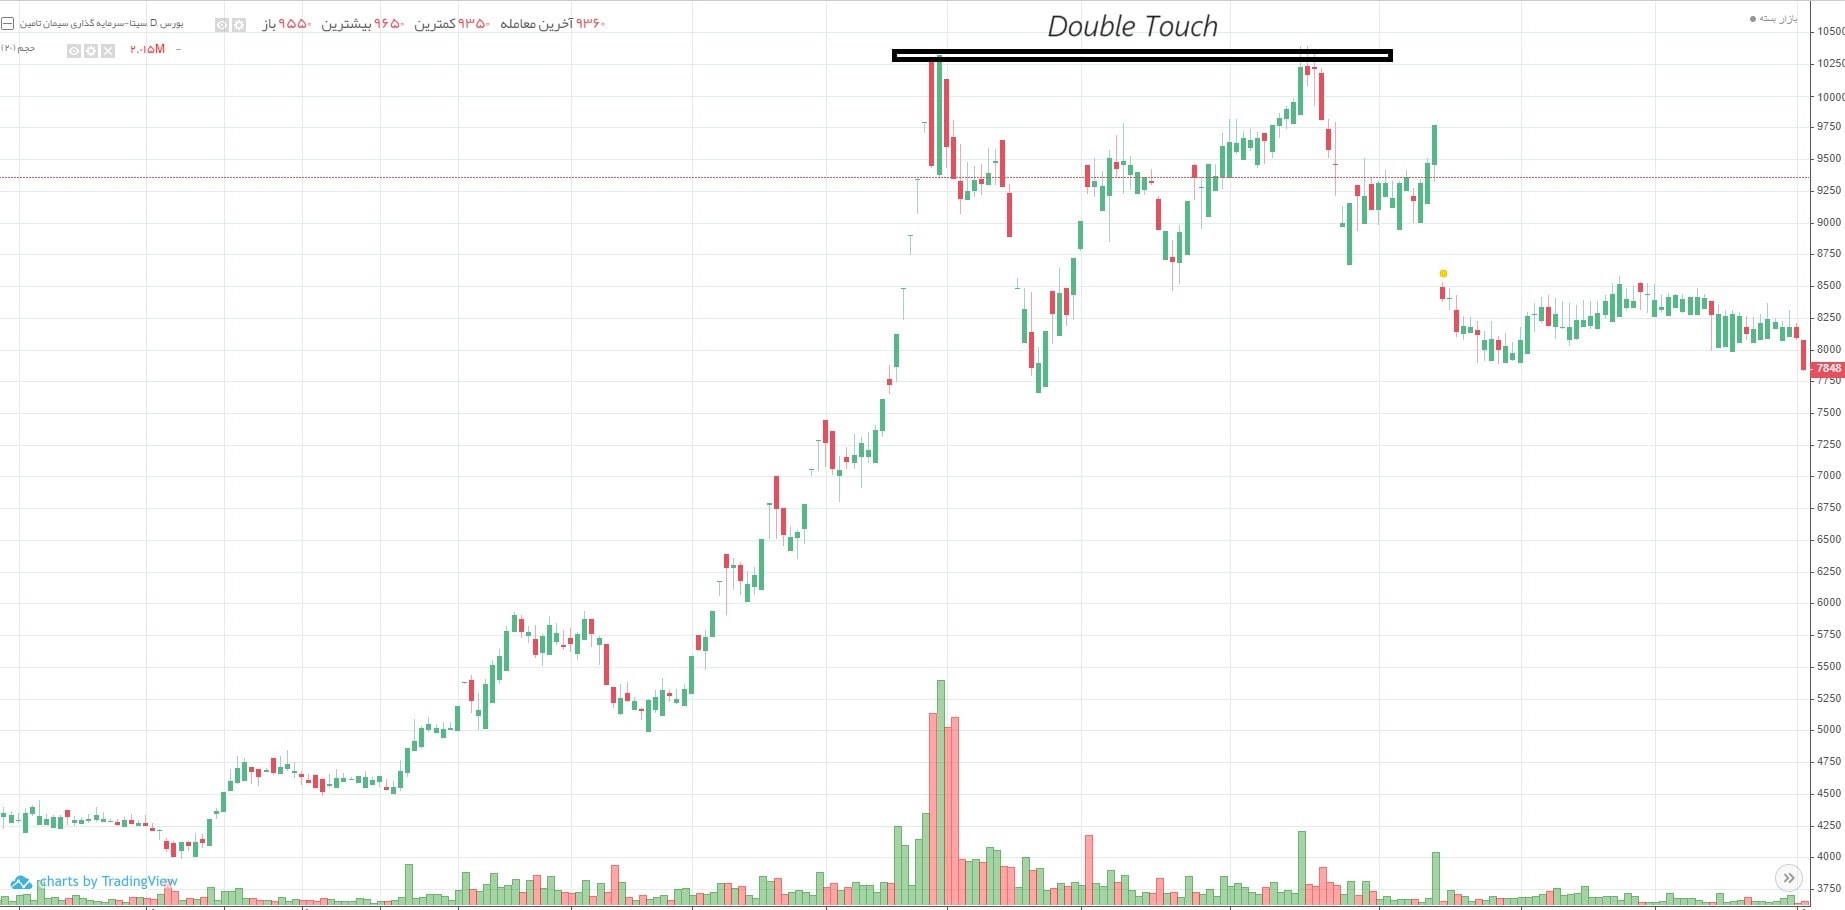
How to analyze a stock technically?
In the above figure, you can see from the symbol of Sita that the market ceiling was formed by hitting the resistance level again, it was not able to pass to higher prices, and with the “Harami” and “Evening Star” candlestick pattern, we saw a price drop.
This pattern can be used in all markets and in all different time frames, but it should be noted at what level the price is and what is the power of movement and price potential. Taking into account all the different parameters, it is possible to (sell) with the trigger created in the end candles. The image of this state is formed at the bottom of the price, and in that state, you can start a purchase transaction.
Types of technical analysis styles
From the above, it can be concluded that there are different technical analysis methods. Now let’s look at technical analysis using Elliott’s method:
The Elliott Wave method is one of the types of technical analysis and is one of the most complex and at the same time the most attractive tools used by professional traders. Developed by Ralph Nelson Elliott, an accountant and financial analyst, in the 1930s, this method is based on a theory that states that price movements in financial markets move in predictable waves that consist of five main rising (leading) and The three main waves are on the decline (countertrend).
Steps of Elliott method analysis:
- *Understanding waves*: The Elliott pattern usually consists of eight waves; Five waves are in the direction of the trend (motivational waves) and three waves are against the trend (corrective waves). Motivational waves are indicated by numbers 1 to 5 and corrective waves are indicated by letters A to C.
- *Leading Waves (Rally)*: These waves contain a strong trend in the general direction of the market. Waves 1, 3, and 5 have an upward trend, and waves 2 and 4 have a corrective role and are often created in the opposite direction of waves 1 and 3. Usually wave 3 is the strongest wave.
- *Anti-trend waves (corrective)*: After the completion of five leading waves, three corrective waves are formed. These waves are against the direction of the main trend and are meant to correct and return prices.
- *Fractals*: The basis of Elliott’s theory is based on the assumption that every wave divides itself into a fractal (that is, repeating itself in smaller and larger scales). This means that a large wave can have smaller waves that themselves follow a pattern of five leading waves and three countertrending waves.
- *Counting waves*: To use this method, the trader needs to identify and count different waves. Correct wave counts are critical because trading decisions are made based on them.
- *Fibonacci ratios*: In Elliott analysis, it is common to use Fibonacci ratios to predict the end of waves. Interactions between waves are often evaluated by Fibonacci ratios such as 0.618, 1.618 and other ratios.

The stages of Elliott’s analysis
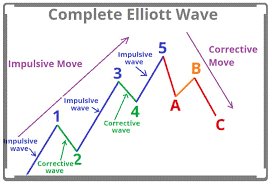
The stages of Elliott’s analysis
Elliott’s analysis challenges:
- *Unbiased mentality*: Analysis in this way requires a flexible and unbiased thinking. Most analysts may miscount the waves due to having a preconceived positive or negative view.
- *Uncertainty*: Wave counts can be highly subjective and even differ between professional analysts. This may lead to different interpretations of the market.
- *Complexity*: There are so many rules and exceptions to be aware of when analyzing waves that it can be confusing for a novice.
Elliott wave analysis can be a very powerful tool for traders, especially when used in conjunction with other technical analysis tools such as volume indicators or moving averages. This method takes a lot of time and practice to learn properly, but it can help traders predict potential entry and exit points, as well as price peaks and valleys, more accurately.
What software should we use for technical analysis?
You can use the DT (Dynamic Trader) analytical platform for Elliott’s technical analysis. The Dynamic Trader platform connects to the Metatrader program and sends price data to DT, and the analyst can perform Elliott analysis on the Dynamic Trader platform. This platform is only used for technical analysis and does not have trading capabilities, that is, you cannot buy or trade on the Dynamic Trader platform. Technical analysis can be done from other platforms such as MetaTrader, NinjaTrader and others, but those who do Elliott analysis professionally know that this platform provides more tools to the analyst.
The best method of technical analysis
In response to “Which technical analysis is better” should be answered: technical is a combination of all tools, but in general, a financial market analyst should perform technical analysis without indicators, technical analysis with the help of indicators, and Elliott Wave Counting style of analysis. and can provide a more correct analysis from all this knowledge. Also, you should always take help from the power of the market. The market follows the laws of nature and the laws of mathematics and physics also exist in nature. For example: according to the laws of physics, if you throw a ball with acceleration, it will go to a level where more force was applied at the beginning, and if the initial start is small, the “ball” will travel a smaller distance. In the market, this case is seen very often that if the acceleration of the price movement from the support level is low, the price will probably not have the power to rise further, and if the acceleration of the price movement from the support level is high, it is likely that the price will see higher levels. . Always keep in mind that there is no certainty in the market and the trader must be flexible.
Technical analysis checklist
“Technical Analysis Checklist” refers to a set of steps and criteria that a technical trader should consider before making trading decisions. This checklist helps to ensure that all key aspects are considered and that the analysis process is carried out carefully and according to a systematic approach. Below is a sample technical analysis checklist:
- *Determine time frame*: Deciding on what type of trades the current analysis will be used for? For which day trading, medium term or long term is used.
- * Checking the general trend*: Determining whether the market is in an upward, downward or neutral trend and this is determined by checking the price peaks and valleys.
- *Chart Analysis*: Analyze price charts such as candlestick, line, or bar charts to find chart patterns.
- *Identifying support and resistance levels*: Determining key points where price movement can be expected to stop or reverse.
- *Checking Chart Patterns*: Types of patterns such as head and shoulders, triangle patterns, and others that may show signs of a trend change.
- *Using Indicators and Oscillators*: Using tools like RSI, MACD and Bollinger Bands to identify overbought or oversold conditions and other trading signals.
- *Trading Volume Analysis*: Using trading volume data to determine the strength or weakness of a trend or pattern.
- *Elliott Waves Review*: If you are using Elliott Wave Theory, try to identify dominant wave or correction patterns.
- *Using Fibonacci ratios*: Determining potential price reversal points using ratios such as Fibonacci retracement ranges.
- * Determining the risk management strategy*: Determining the place of placing stop-loss orders and also the times of taking profit.
- *Price Saturation*: Do you see price saturation at resistance or support levels? Do the indicators show different signals?
- *Flexibility and Revision*: Readiness to adjust or change strategy with new information or as market conditions change.
This checklist can serve as a basic framework for technical analysis and help traders to have a systematic and orderly view of their trades and decision making process. It should also be noted that these may change depending on the strategy and personal preferences of each trader.
Summary:
Technical analysis, which studies the history of price movement and trading volume based on price charts, includes several main components and tools used to predict future market trends and make trading decisions. The most important of these include the following:
- *Charts*: The main tool of technical analysis that helps traders identify price patterns and trends. Different types of charts include line charts, candlestick charts, bar charts, and point and number charts.
- *Trends*: Identifying the market trend, whether it is up or down, or even a neutral market or no trend, is an important principle in technical analysis. Trends are usually divided into three categories: long-term, medium-term and short-term.
- *Support and Resistance*: These are the price levels where the price movement often stops and reverses. A support level tends to keep the price high, and a resistance level, on the contrary, acts as a price ceiling.
- *Chart Patterns*: There are different types of chart patterns such as head and shoulders, triangular patterns, flag, banner, double floor and double ceiling and other patterns that may indicate trend reversal or continuation.
- *Technical Indicators*: These indicators, which are often calculated mathematically from past prices and volumes, include moving averages, movement indicators such as relative strength index (RSI), Bollinger Bands, moving average convergence/ divergence (MACD) and stochastic.
- *Volume*: Analyzing trading volume is important because it shows the amount of support and strength behind a price movement.
- Elliott Wave Theory: According to this theory, price movements in financial markets follow the patterns formed in waves.
- *Fibonacci Ratios*: These ratios are used to determine reversal or correction levels in the price trend.
- *Dow Theory*: One of the oldest bases of technical analysis that examines market forecasting based on trends and levels of support and resistance.
- *Quantitative Analysis*: including the use of mathematical and statistical models to evaluate price movements and identify trading patterns.
- *Other tools and techniques*: such as pivot points, price channel analysis and other different methods that technical analysts use in completing their strategies.
Technical analysis can be applied on different time scales, allowing traders to identify entry and exit points, manage risks and develop optimal trading strategies.

