Technical analysis training
Introduction:
Technical analysis training is used in financial markets to predict price movements and make decisions about buying or selling financial assets. This method relies on the analysis of patterns, charts, and various indicators that appear in reports and price charts.
Technical analysis is based on the principle that the history of price movements can create repeating patterns, and through this, traders can predict potential future movements. This method includes concepts such as trend lines, support and resistance points, relative market strength indicators, and chart patterns such as triangle, double touch, and head and shoulders patterns.
In technical analysis, analysts use different tools to evaluate the amount of interest and probability that an asset enters or exits the market. These evaluations help traders to make optimal decisions and smarter strategies to manage capital and reduce possible risks.
Due to the complexity and continuous changes in the financial markets, technical analysis is considered as an important method for traders and investors, which helps them make more rational decisions in the field of buying and selling assets. In this article, we are going to put technical analysis training from zero to hundred in a simple language in a practical and concise way. So if you are looking for free technical analysis training, stay with us.
In the continuation of the technical analysis, we will look at the graphs in the price chart
Charts graphically display currency pair price information over time. Three types of charts that are widely used in technical analysis are:
– Linear graph
– Bar graph
Which type of chart an analyst uses depends on the type of information they are looking for and their individual skill level.
*Line chart*: Line chart is the simplest chart in technical analysis. Usually, this chart shows the closing price of the symbol in the specified time frame, over time. The line chart ignores the shadows of the candles.
*Bar Chart*: Bar charts are used to show the price movement of securities over a period of time. In a bar chart, the open, close, high, and low prices of a stock or other financial instrument are embedded in a bar graph. The set of these bars, which is made up of vertical lines, represents each price point in the determined time frame.
And also the candlestick chart, which we explain below.
First part: Identifying the price ceiling and floor in the market
In the first stage, to teach technical analysis in simple language, we will discuss the ceiling and floor of the market. An analyst must recognize resistance levels and price supports in the chart, for this purpose we must use the candlestick chart. So we need to know what a candle is and what its states are and what each candle represents.
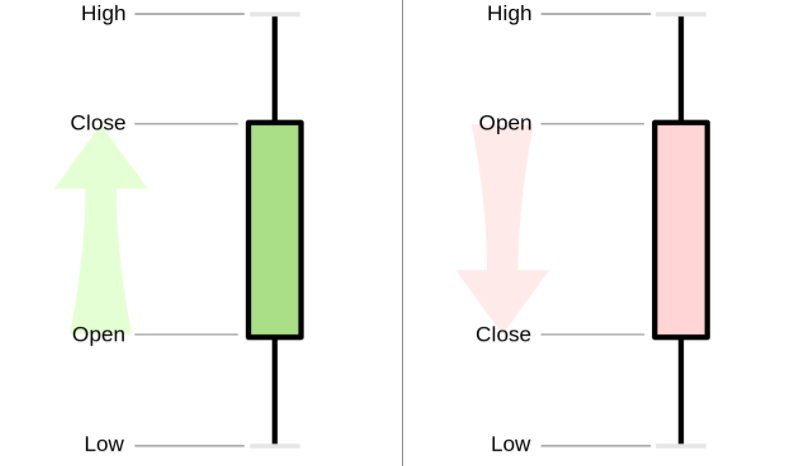
Candlestick Chart : Candlestick chart is one of the important tools of technical analysis in financial markets . These charts are used to show changes in asset prices over specific time periods. Each candle represents a specific time frame, such as a minute to a day, a week, or a month. Each candle has parts called “body”, “upper shadow” and “lower shadow”.
- *Body:* The rectangular part of the candle that is located between the opening and closing price in a time frame. If the closing price is higher than the opening price, the body is colored green (or white), indicating price growth. If the closing price is lower than the opening price, the body is colored red (or black), indicating a decline in price.
- *Upper Shadow:* A vertical line from the top of the body to the top that shows the maximum price in a time frame.
- *Lower Shadow:* A vertical line from the bottom of the body to the bottom, indicates the minimum price in a time frame.
Identifying the price ceiling and floor in the market
In the above figure and on the left side of the image, an ascending candlestick with an almost large body is formed with a shadow (Shadow) below and above. On the right side, you can see the image of the bearish candle, which, like the bullish candle, has a band and two shadows. The difference between these two candles is the opening price and the closing price. In the bullish candle, the price first opened and formed two shadows and finally closed at a higher price. But in the bearish candle, when the price opened, it finally closed at a lower price. Shadows indicate the amount of buyer power or buyer fear. The closer the price is to the resistance level, the candlesticks that approach the resistance level form a higher bar above. This represents the cashing out of purchase deals that buyers had at lower prices.
The candlestick chart analyzes various patterns and indicators that appear in them. Some common patterns include “single candlesticks” such as Ingalf, Hummer candles, and multi-candle patterns such as the “Evening Star” or “Morning Star” pattern.
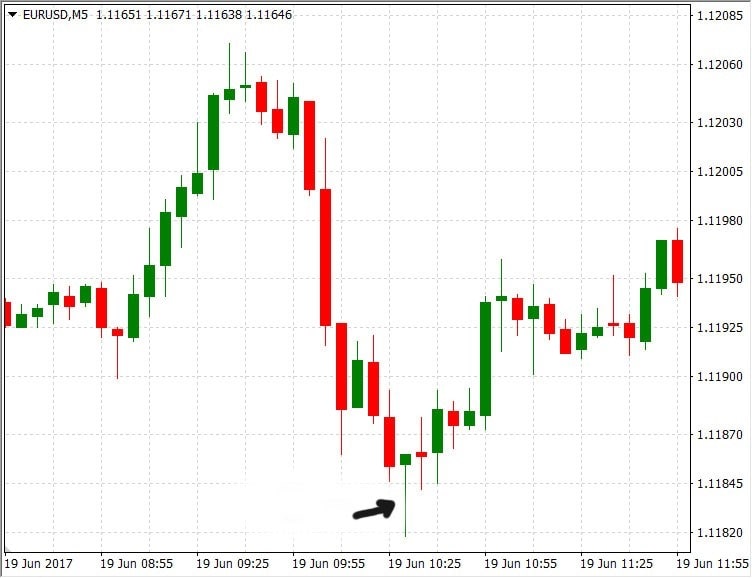
In the figure below, you can see a candlestick chart, the candle is formed at the bottom of the market with a long high in the lower part, and it means that the sellers were very afraid and quickly removed their sales from the market, and the buyers also bought the deals. and finally a candle was formed with a long bottom and a short body, and the possibility that the price will rise after this candle is very high, as you can see in the figure, the price after this candle completely rose and saw higher prices.
Identifying the price ceiling and floor in the market
Identification of support and resistance:
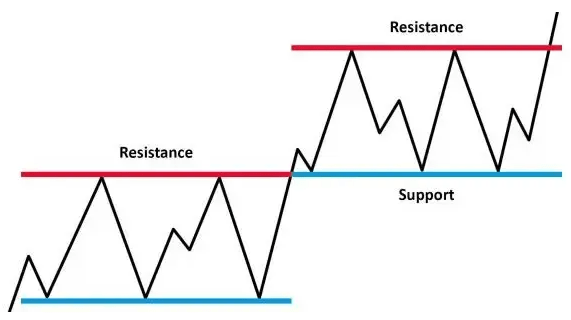
Identifying support and resistance levels is one of the most important steps of technical analysis in Forex trading (or any other financial market). These levels are the points where the price undergoes important changes and may have a positive or negative effect on the price movement.
1- Support:
– *Definition:* A point on the chart that the price has approached and usually prevents further decline.
– *Explanation:* Support may be shown as horizontal lines, range zones. This point can be determined based on price history, chart patterns, or technical indicators.
2- Resistance:
– *Definition:* A point in the chart that the price has approached, but usually stops it from continuing to grow.
– *Explanation:* Resistance may also be shown as horizontal lines, range areas, or horizontal lines. Traders often look to break resistance levels, as this may lead to larger price swings and further uptrends.
Important points in identifying support and resistance:
– *Confirmation by Volume:* When price approaches a support or resistance level, trading volume may increase, acting as confirmation for the possible strength of this level. (To see the volume, you must use level 2 data, these data are displayed on special platforms such as NinjaTrader, SiraChart, etc., and you must subscribe to receive the volume.
– *History of determining levels:* Using past data to identify support and resistance levels can be helpful. Points that have been identified as strong points of support or resistance in the past may be influential in the future.
– *Using patterns:* Chart patterns such as head and shoulders, double touches, tops and reversal trends can help identify support and resistance levels.
By knowing and using these levels properly, traders can make better decisions about entering or exiting their trading opportunities.
Identify support and resistance
How to learn technical analysis?
Next, you should learn the ascending and descending market, or the ascending and descending price. In the above section, we explained the resistance and support, and now we will define the bullish and bearish market in the chart.
Bullish market: Bullish market and bearish market are two main situations in forex trading, which are used by traders to analyze and predict the direction of price movement. Understanding these two basic situations is essential for deciding whether to enter trades or exit trades.
1- Bullish Market:
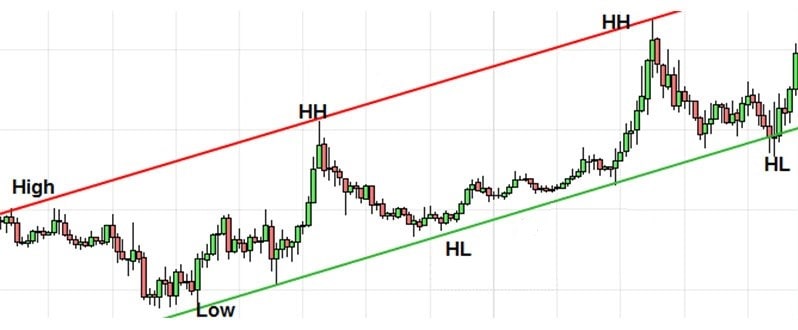
In a bull market, prices generally move in an upward trend and prices are making a higher ceiling than their previous ceiling and a higher floor than their previous floor, or in other words, the market is making (HH) and (HL) It is new in the market. In this situation, traders are looking for opportunities to buy and increase their capital, and also in the price charts, the height of the candlestick chart and the acceleration of the price rise in a short time indicate a bullish market.
bullish market
Indicators:
– Chart of candlesticks with long bodies (white or green).
– Increasing the volume of transactions during the upswing.
– Breaking resistance levels.
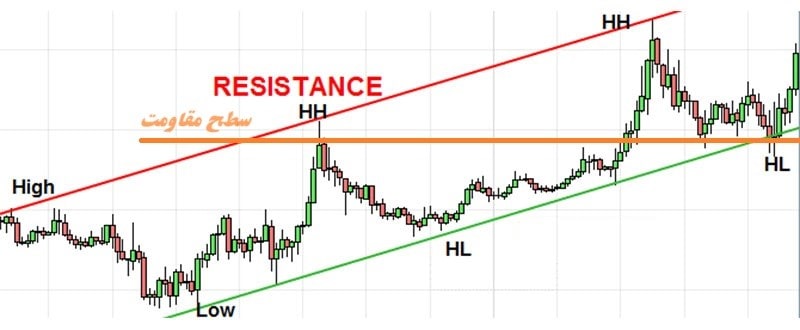
bullish market
As we can see in the figure above, the price is making higher ceilings and floors than its previous ceilings and floors and also crossed its resistance level. By confirming the indicators related to the buy signal above the resistance level, you can buy. This buying setup is called “breakout”.
Poleback breakout setup in the subject of step-by-step technical analysis training:
When the price reaches above the resistance level and so-called “breakout”, the buyers increase the demand with their purchases and the price reaches a higher level and registers a new HH. They make a profit in cash, which causes price supply and price reduction, this price reduction is formed in an erosional and slow way, which is also called “pullback” or “correction”. When the price reaches the price floor in the resistance range, this price level acts like a support level, and since no reason has been seen to decrease the price, and the reason for the price increase was formed in this range before, the price starts to grow from the support level again. slow This level is also called the transformation of levels (resistance to support).
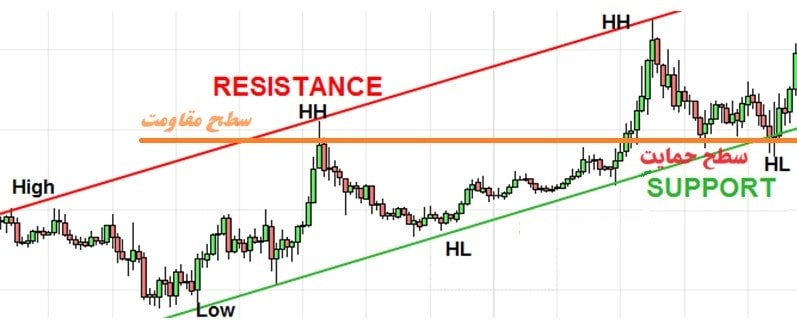
bullish market
Turning resistance into support:
One very strong reason to enter a buy trade is the reversal of levels, which is very common in all time frames and in all markets.
strategies:
– Buy at the breaking points of the resistance levels (breakout stop) or buy at the support level (stop conversion levels).
– Using indicators like RSI or MACD to confirm market strength.
– Using trigger candles, such as Hummer or Ingalf candles, or candle arrangements (Morning Star). There are several trigger candles that can be used to confirm an entry.
2- bearish market:
In a bear market, prices generally move in a downward trend and prices are making a lower floor than their previous floor and a lower ceiling than their previous ceiling, or in other words, the market is making (LL) and (LH) ) is new in the market. In this situation, traders are looking for opportunities to sell and withdraw their capital from the purchase transaction, and also in the price charts, the length of the descending candlestick chart and the acceleration of the price decline in a short time indicate a bearish market.
Turning support into resistance:
One of the very strong reasons to enter a sell trade is that it is seen repeatedly in all time frames and in all markets.
Indicators:
– Taking help from the shape of the candles
– Increasing the volume of transactions during the downturn with the help of level 2 data
– Breaking support levels.
strategies:
– Selling at resistance points or breaking support levels.
– Using the stock stick or RSI indicators to confirm the strength of the bearish market.
The most important point in forex trading is that by knowing the market situation (up or down), traders will be able to choose the right strategies and tools for risk management and better productivity from the available opportunities.
And in the continuation of the zero to hundred technical analysis training, we will focus on the trend line
Trend Line : It is one of the most important and practical tools that every technical analyst should know.
A trend line is a line that connects two points A and C and may include a third level. In the figure below, the left side shows the upward trend line and the right side shows the downward trend line.
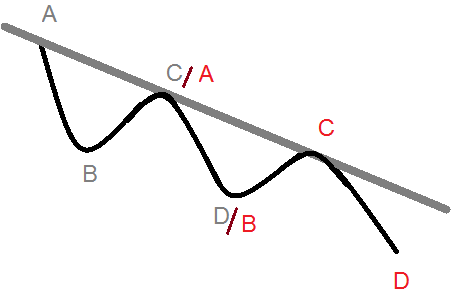
Trend Line
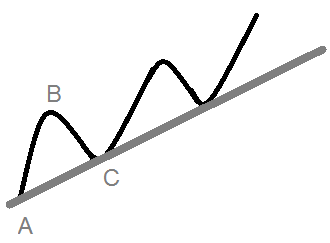
Trend Line
Note: In the upward trend, the trend line should include the new HL points, and in the downward trend, the trend line should include the new LH points.
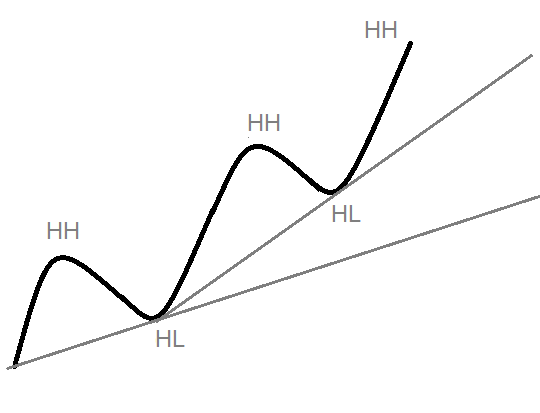
Trend Line
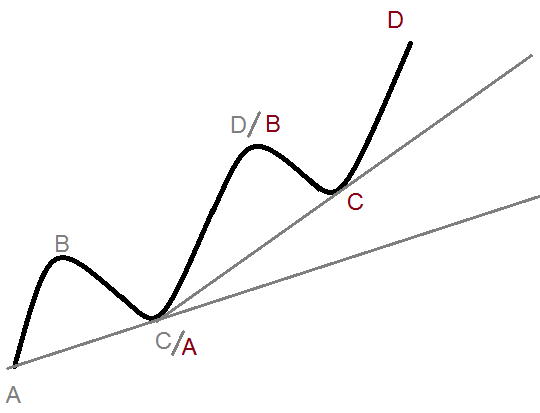
Trend Line
Types of trend lines:
1- Inner Line:
2- Outer Line:
3- Long term trend line:
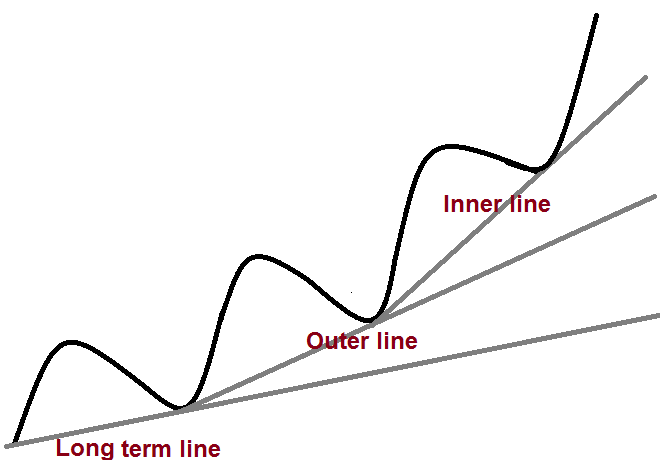
Types of trend line
tip :
There is never an inner line at the beginning of the chart because the inner line is at the end of the chart and in the heart of the outer line.
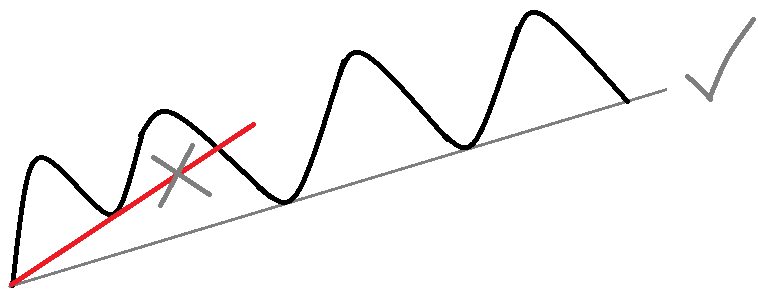
Types of trend line
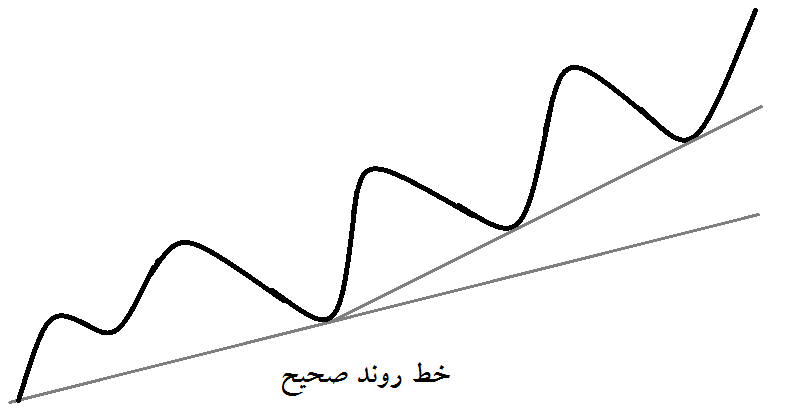
Types of trend line
Conclusion :
In this article, we examined technical analysis in forex trading as the best technical analysis course and explained its basic principles in a very practical and simple language. Technical analysis, by examining patterns, charts, helps traders identify different market patterns and make smarter decisions to enter or exit trading opportunities.
During the technical analysis training article from zero to hundred, we learned the basic concepts such as support and resistance, chart patterns, and levels of technical analysis. Also, we examined the use of tools such as break-out setup, pull-back breakout, and conversion of levels and trend lines for better risk management and productivity in forex trading.
Technical analysis allows traders to take advantage of market patterns and charts and make decisions based on accurate and methodical analysis. By deeply understanding and following these principles, traders can improve their trading process and achieve greater profitability in the challenging world of forex trading.
In the end, mastering technical analysis is considered one of the most important tools for traders to dominate the market.

