Technical analysis patterns
Introduction:
In the forex market, technical analysis is one of the basic methods for predicting the direction of price movement. This method is based on principles with the belief that the history of prices and trading volume can provide patterns that will help make future trading decisions. Technical analysis patterns can include price patterns such as Japanese candlesticks, pivot points, and trend lines. Each pattern individually indicates a specific market condition and is usually combined with other patterns and market conditions to make better trading decisions.
The use of technical analysis patterns requires a deep understanding of price behavior and market conditions. In addition, factors such as economic news and global events should also be carefully considered as they can have a direct impact on market behavior.
By using technical analysis patterns, traders are able to recognize hidden patterns in the market and use them for their trading decisions. This method, along with proper risk management, can help traders make the best decisions in the dynamic and complex forex market.
There are many methods and patterns in technical analysis, the knowledge of which helps traders in analyzing the market trend so that they can achieve more profit in their transactions.
Technical analysis patterns give signals to traders regarding the bullish or bearish trend of the market. Investors can recognize the price movement by using trend lines in price patterns.
Types of chart patterns
There are generally three types of chart patterns. When an asset’s price trend reverses after a price pattern, it is known as a reversal pattern.
A continuation pattern occurs when the trend continues in the same direction after a short period of price stabilization. There is another continuation pattern and it occurs when the trend starts to fluctuate within a price range after a period. In this article, we discuss the types of patterns in classical technical analysis in forex. Stay with us until the end of this article to learn more.
Above, we noticed that in general, the price is in three directions, either the price has an upward trend or a downward trend, or the price has no trend and the price fluctuates in a range.
So, in the form of these three modes, there are different patterns to recognize.
Types of patterns in technical analysis
In general, it can be said that there are 5 types of patterns in technical analysis, which include the following:
- Classic price patterns
- Candlestick patterns
- Harmonic patterns
- Elliott waves and its price patterns
- Indicator patterns
In the following, we will examine the performance of all these patterns.
The first part
Classic price patterns:
Price patterns are one of the most common patterns in technical analysis. It is very important to correctly identify trend lines and draw them in price patterns. Trend lines actually define the areas of support and resistance in the price chart and are important points or triggers that can be used as a confirmation of the continuation of the trend or a warning of a change in the trend. For example, head and shoulder patterns are advanced classic patterns that are likely to change when they are formed.
The price patterns themselves are generally divided into two categories: continuing price patterns and reversal price patterns, however, there are also patterns that are two-way patterns, which means they can bring both continuation of the trend and reverse movement of the previous trend. In the following, we name the most famous price patterns and explain them briefly.
1- Triangle patterns in technical analysis:
The triangle pattern is one of the price continuation patterns. Continuing price patterns are patterns or shapes that, if the price chart is entered and exited, the price trend will be the same as before. Among the most common continuing price patterns, we can mention the flag pattern, the ascending triangle pattern or the descending triangle pattern.
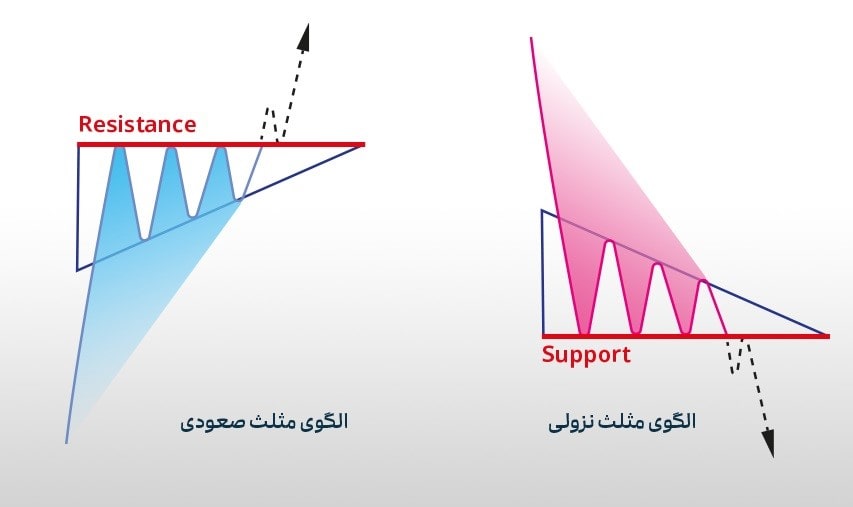
Analysts classify the triangle pattern as continuing patterns, which are divided into three categories: “Ascending Triangle Pattern”, “Descending Triangle Pattern” and “Symmetrical Triangle Pattern”.
An ascending triangle pattern is formed when the trend line at the bottom of the chart crosses the upper horizontal line. The upper horizontal line on this chart represents the resistance level. After exiting this triangle, the price will have an upward trend, which means that the power of buyers is still greater than the power of sellers.
Triangle patterns in technical analysis
The descending triangle pattern is an inverted version of the ascending triangle pattern. In this pattern, a breakout occurs when the trend line at the top of the chart crosses the horizontal line at the bottom of the chart, which represents the support level, and the price continues below the support level, meaning sellers are in control of the market.
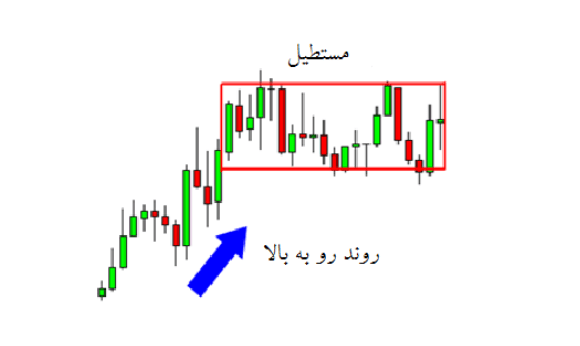
2- Rectangle pattern in technical analysis:
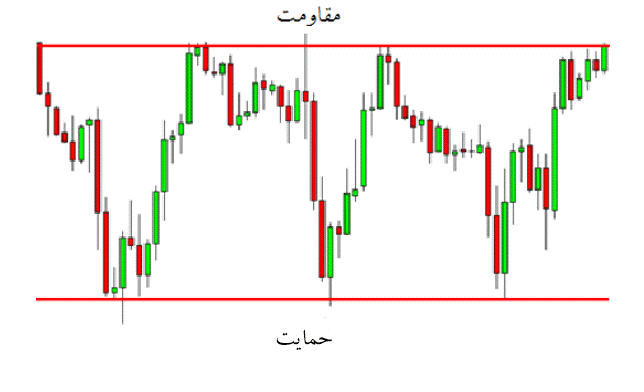
A rectangle is a chart pattern that forms when price is surrounded by parallel support and resistance levels. The rectangle pattern indicates a period of price stabilization or uncertainty between buyers and sellers. While they take turns punching each other, none of them wins. The price touches and tests the support and resistance levels many times before breaking. The price may form in the direction of breaking the trend, whether it is bullish or bearish.
Rectangle pattern in technical analysis
In the example above, we can clearly see that this currency pair is surrounded by two key price levels that are parallel to each other.
We have to wait until one of these levels breaks and starts the trend.
Descending rectangle pattern
A descending rectangle is formed when the price stabilizes for a while during a downtrend. The reason for this is that sellers probably see no reason to move higher or lower from the formed levels, the formed levels are a strong price pattern that can be broken by a reason such as news. So whenever you see a pattern, know that traders are probably waiting for news and have no reason to increase the volume of their trades, and have even cashed out part of their trades.
Descending rectangle pattern
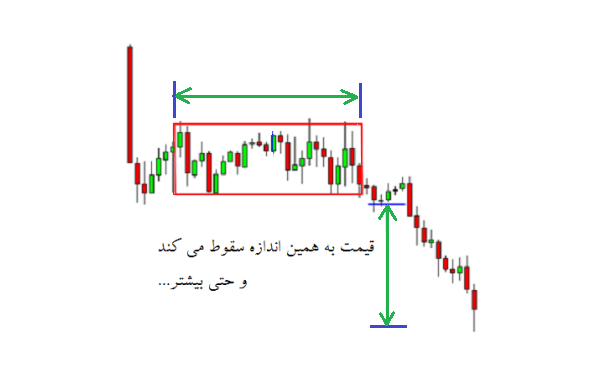
Descending rectangle pattern
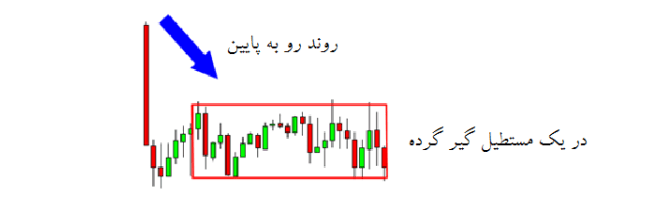
In the figure above, you can see that after a period of fluctuation within a rectangular range, the price has seen a drop from the bottom of the rectangle.
Note: In most cases, if the price is trending and it is limited inside a rectangular pattern, it tends to continue its previous trend after breaking the rectangle level. In the figure above, there was a downward trend, and after the price broke, the price continued its downward trend.
Ascending rectangle pattern
Ascending rectangle pattern is one of the continuation patterns that is formed during the ascending trend. When in an upward trend, we see the range and fluctuation of the market in a specific support and resistance range, it is said that the market is resting. At this stage, one should only wait for the complete formation of the pattern and the breaking of one of the support or resistance lines. After the failure of one of the lines, the price chart continues to move in the same direction as before and a decision can be made regarding the transaction.
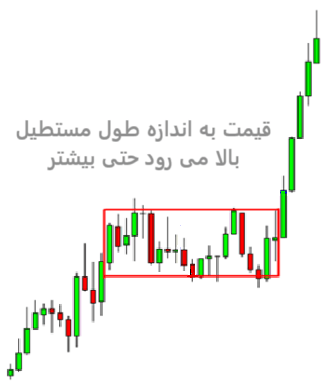
Ascending rectangle pattern
Ascending rectangle pattern
Identifying the rectangle pattern in technical analysis
To identify this pattern, you must first find a clear trend in the price chart that is reviving and consolidating. After finding such a situation in the chart, you should find at least two price peaks and two price valleys that are formed horizontally and parallel to each other, and these peaks and valleys are created in such a way that by connecting them together, lines Support and resistance are drawn and a rectangular pattern is formed.
Identifying the rectangle pattern in technical analysis
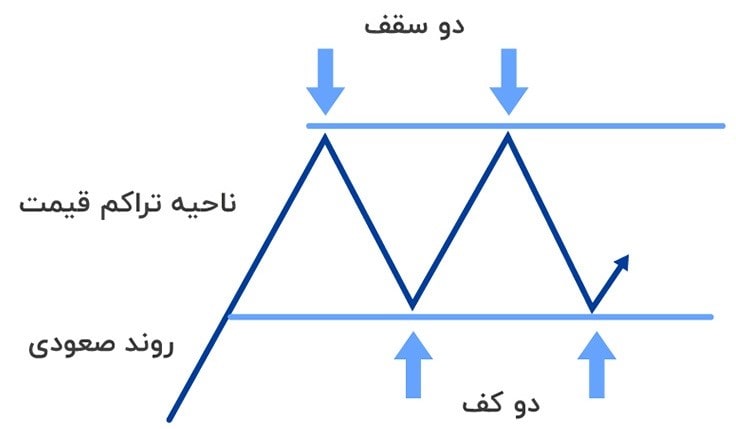
3- Double touch pattern :
Double touch or twin roof or double touch is one of the returning patterns.
Perhaps it can be said that reversal patterns can be more attractive for analysts because they warn of the formation of a new trend and it is necessary for traders to reconsider their trading position. Double roof and floor patterns, triple roof and floor patterns, and Sorushane pattern are among the famous return patterns. Some forms of these patterns are shown below.
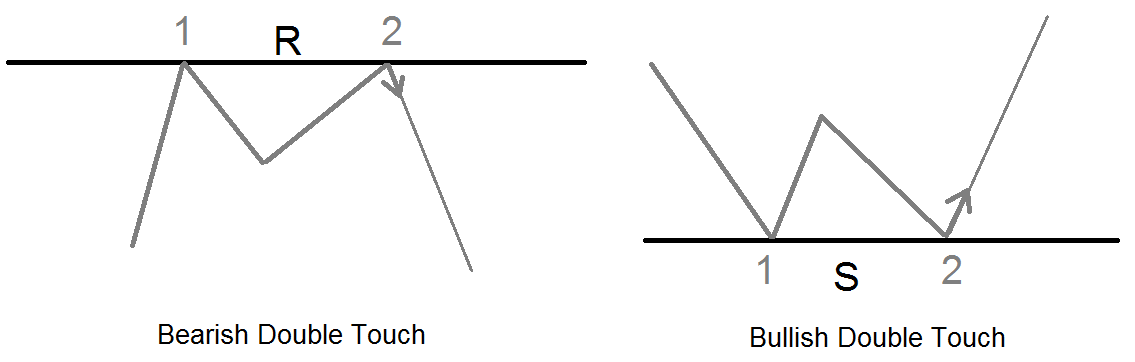
Double touch pattern
In the photo below, you can see how to enter the transaction in the twin roof and floor model.
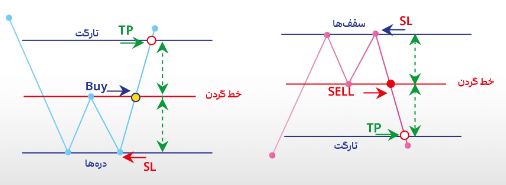
Double touch pattern
4- Triple touch :
In the figure below, you can see the descending and ascending triple touch patterns. In double and triple touch, “market power” is very important.
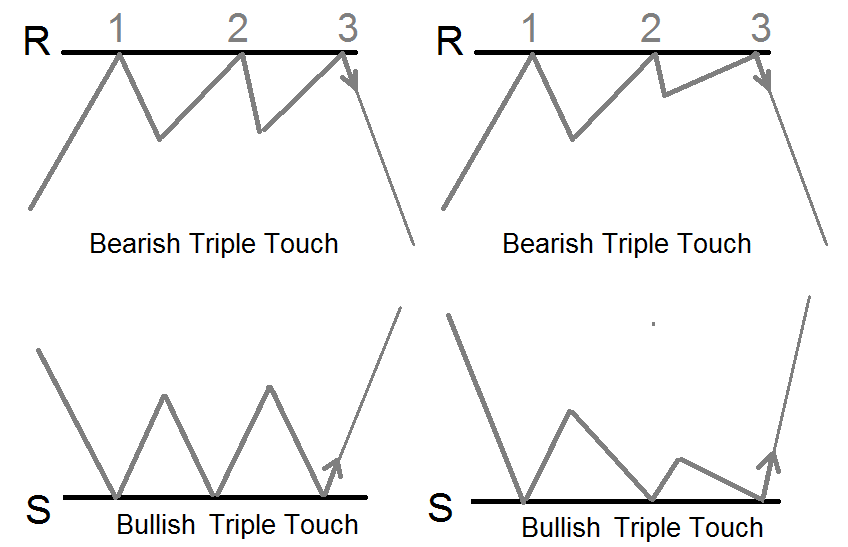
Triple touch
5- ” Head & Shoulders ” or ” King’s Crown ” pattern :

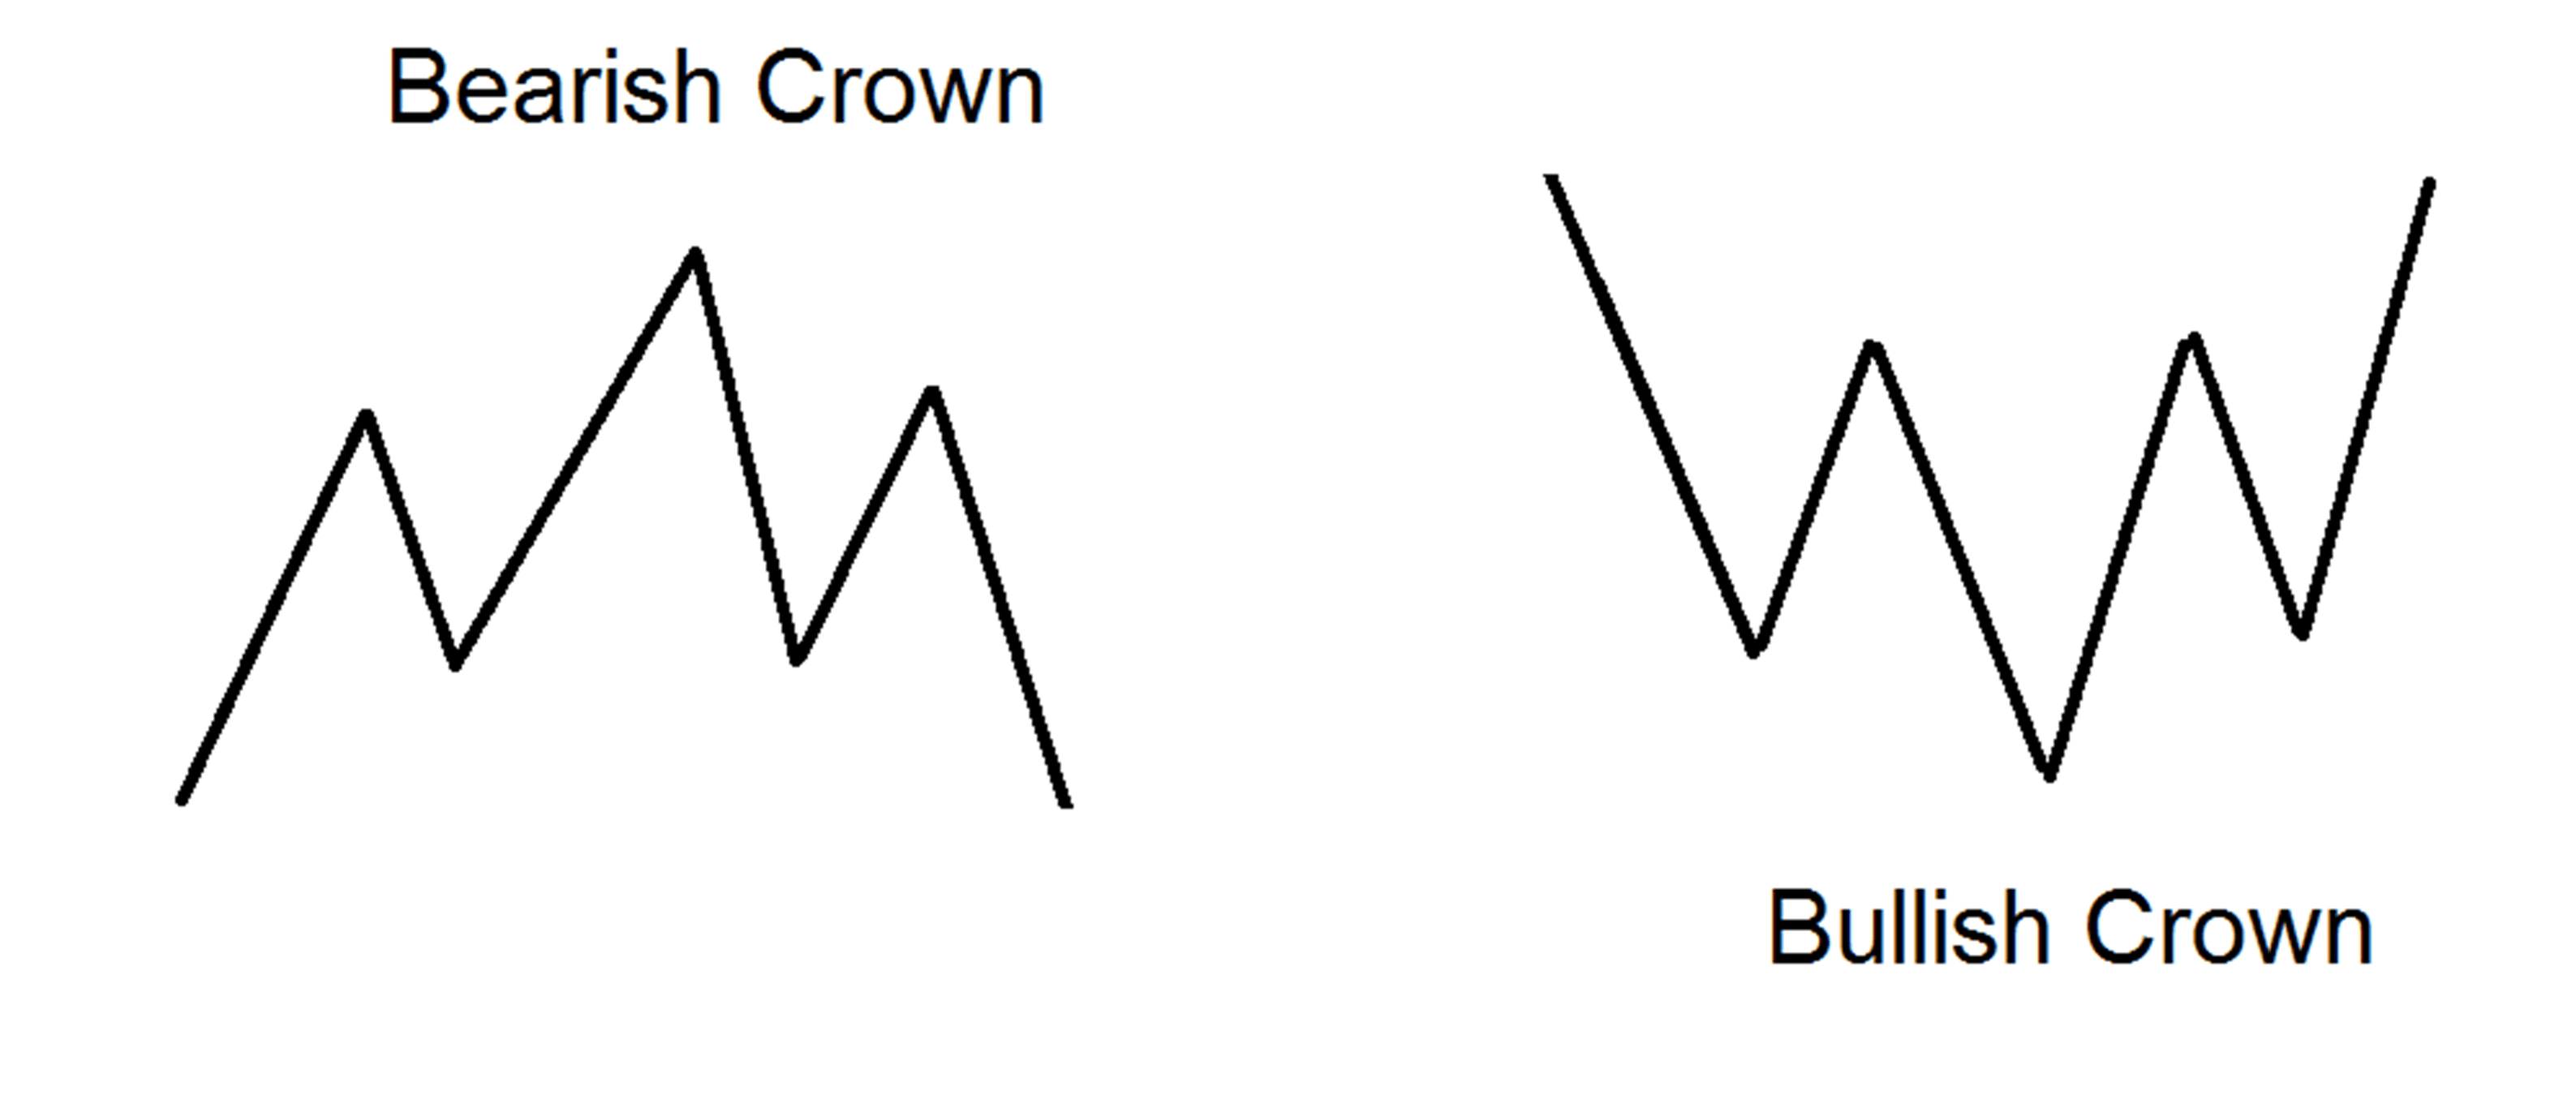
“Head & Shoulders” or “King’s Crown” pattern
One of the useful tools for predicting market trends is price chart patterns. The Head and Shoulders Pattern is one of the most important technical analysis patterns that traders in Forex, digital currency and all financial markets can use.
Getting to know the head and shoulders pattern
The Head and Shoulders Pattern (H&S) helps traders identify how the market trend line changes after the end of a trend. In technical analysis, the head and shoulders form a pattern that indicates a change in the market and the beginning of a reversal trend. Head and Shoulders is a pattern with three peaks, where the left and right peaks (shoulders) are the same size and the middle peak (head) is higher than the other two peaks. This pattern is formed when the share price reaches its ceiling and then reaches its last upward movement.
A head and shoulders pattern is formed when the price reaches its peak and subsequently declines to the previous bullish point.
Advantages of the Head and Shoulders pattern
Like many reversal patterns, the Head and Shoulders pattern has advantages and disadvantages that must be considered when using this pattern. The most important advantages of the H&S model are:
The H&S pattern is one of the most reliable analytical patterns by sending many strong signals. The neckline in this pattern is one of the most important factors that can determine the time of entry and exit in a transaction with the aim of making a profit. Using the H&S pattern, it is possible to predict the change from an uptrend to a downtrend. It takes a lot of time to recognize this pattern and the trader must be patient to complete all the components of the pattern. Like any other pattern in technical analysis, there is a possibility of error in the H&S pattern. (The neck line may be broken several times and the expected result may not happen.) The trader must have enough knowledge and skill to identify the head and shoulder pattern, and beginners may make mistakes and trade against the right process.
Part II:
Candlestick patterns
Candlestick chart is one of the most used charts in technical analysis. This chart, like other charts, shows price changes, and traders can have a more detailed and detailed look at the chart by using the candlestick. For traders, the candlestick chart is much more interesting and easier to interpret compared to other charts, as each of these candles shows price movements in the market, and these candles consist of two types, ascending and descending. .
Japanese candlestick patterns
Actually, candle literally means candle and candlestick means candlestick, and by drawing these patterns one after the other, a candlestick chart is created. Using candlesticks, we can find out the high, low, closing and opening prices, which indicate the behavior, emotions and type of decisions of traders. The science of candlesticks in financial markets, despite the fact that it is a subset of technical analysis, but it is also used in the field of market psychology. Different combinations of body and shadow have different meanings that traders get important information about the strength and weakness of the chart by examining the size of the candle’s shadow and body.
Components of a candle
Candles help us to get more accurate information about price movements only by observing them. The components of a candle are divided into two important parts.
Body: The body shows us the power of buying and selling in the candlestick chart. A larger body indicates more buying and selling.
Shadow: The shadow or wick indicates the highest and lowest price in that candle.
Each candle consists of four main components, which are:
opening price, closing price, highest price and lowest price
There are many candlestick patterns, and we will discuss the most important ones in this article:
Candlestick patterns are:
Doji – Gemini – Spinning Top – Ingalf – Hammer – Comet – Morning Star Pattern – Evening Star Pattern.
Doji pattern has several different models except for its standard type:
Long Base Doji: In this pattern, the upper and lower shadows are long.
Doji Dragonfly: In this pattern, the opening and closing prices are equal and it is the highest price.
Tombstone Doji: In this pattern, the opening and closing prices are equal and it is the lowest price.
Four Price Doji: In this pattern, the opening and closing prices and the highest and lowest prices are very close to each other.
third part:
Harmonic patterns
Harmonic patterns are formed by combining geometric shapes and Fibonacci numbers, and Fibonacci ratios are very important in harmonic patterns, and as a result, Fibonacci numbers are considered as the basis of these patterns. Harmonic patterns are mostly used in wave counting methods. Identifying these patterns, compared to classic patterns (such as the flag pattern), requires more practice. But by learning these patterns, you can easily predict the future trend of the price chart.
These patterns often appear in the form of M, W or a combination of both. By calculating the Fibonacci ratios between the important points of the pattern, it is possible to estimate the growth or decline of the price. The structure of all five-point patterns is similar to each other and they differ only in the length of the lines and Fibonacci ratios. As a result, by learning one of these patterns, it will be easier to understand other patterns.
1- AB=CD pattern
This pattern can be called the simplest harmonic pattern. It is very easy to recognize this pattern in the price chart. In the bullish ab=cd pattern, point D is the beginning of strong price growth and you can enter the transaction at this point by sending a buy order.
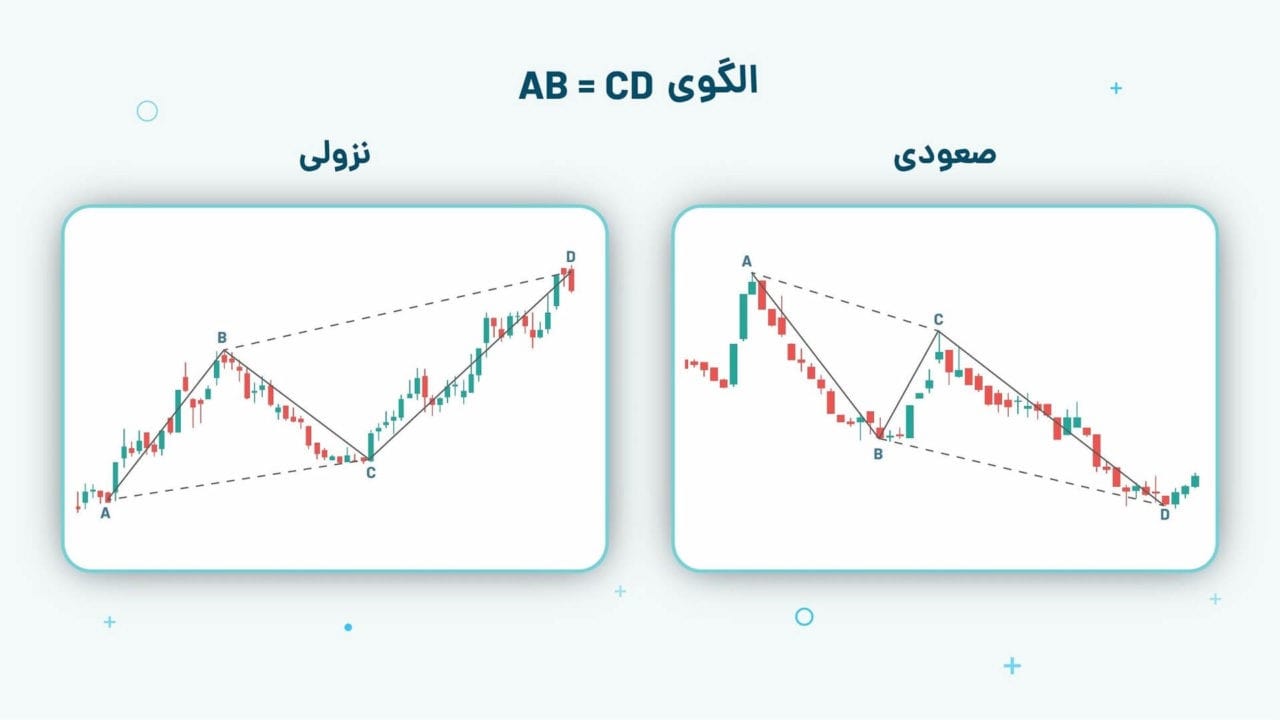
AB=CD pattern
The Fibonacci ratios in the descending AB=CD pattern are also the same as the ascending AB=CD pattern, and the only difference between them is that they are inverted. In the bearish AB=CD pattern, point D is the start of a sharp price drop. In two-way markets, you can make a decent profit from this pattern by sending a sell order at this point and then buying at lower prices. Usually, the end of a trend is in the form of three waves or the formation of an AB=CD pattern.
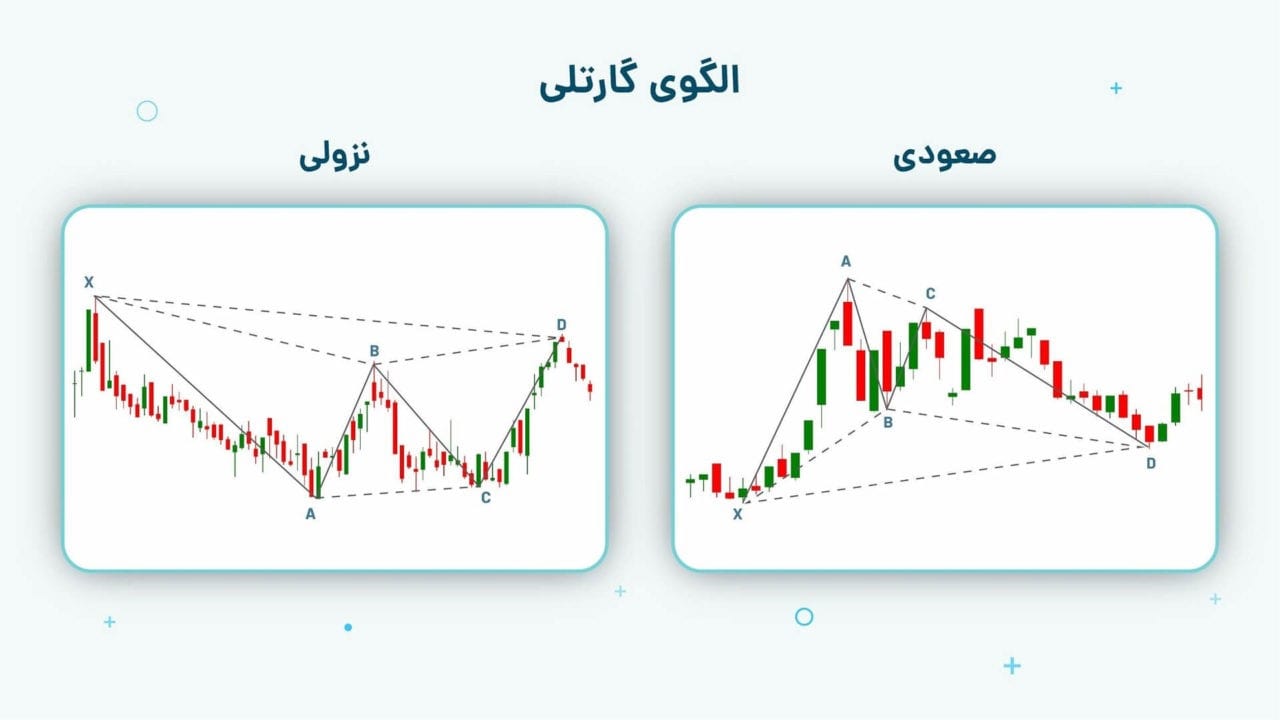
2- Gartley pattern
This pattern will appear in both ascending and descending modes. An ascending Gartley pattern is M-shaped and a descending Gartley pattern is W-shaped. In the ascending mode of this pattern, point X is lower than D and point A is higher than C. Point D is the beginning of the strong upward trend and you can enter the transaction at this point by sending a buy order.

Gartley pattern
3- Butterfly pattern
The butterfly pattern will appear in both ascending and descending states. The upward pattern of the butterfly is in the form of M and the descending pattern of the butterfly is in the form of W, and usually in Elliott and wave counting methods, at the end of a trend, a butterfly pattern is formed.
This pattern is similar to the Gartley pattern in terms of shape, with the difference that in the ascending state of the butterfly pattern, point D is lower than point X, i.e. at the origin of the pattern. Also, the butterfly pattern has deeper price corrections than the Gartley pattern. As a result, in this pattern, the price will experience more extreme fluctuations.
butterfly pattern
There are other patterns such as:
1- Bat harmonic pattern
2- ” Crap ” harmonic pattern
3- ” Shark ” harmonic pattern
4- Harmonic cipher pattern .
All these patterns can be formed in depth. Like a deep crab pattern.
Note: These patterns are formed in a trigonometric area with the Fibonacci percentages defined for them and are of great importance. Patterns can be formed in the second, third or fourth triangular area and their Fibonacci percentages are different. For example, the butterfly pattern can have 4 different shapes with 4 Fibonacci ratios. Therefore, the number of harmonic patterns increases, the most important of which are the patterns formed in a trigonometric region.
The fourth section
Elliott wave patterns
Elliott waves are considered to be one of the most important tools to detect the future trend of the market and its basis is the analysis of price movements in the market. The use of Elliott has actually been the beginning of a big change in the style of technical analysis. The difference between this new tool and the previous tools is in adding a new dimension for analysis, which is the concept of time. While all previous methods were based on the two concepts of price and pattern, with the introduction of the Elliott pattern, time was also added to these parameters. In the rest of this article, we will examine this pattern.
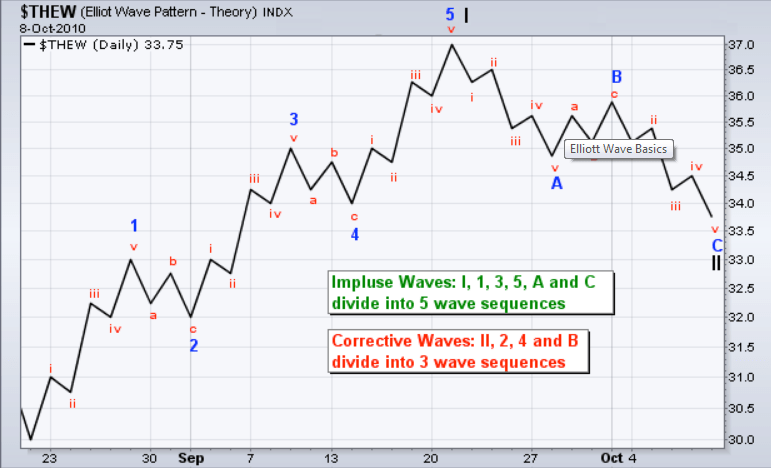
Elliott wave patterns
Corrective waves are always against the direction of the trend and include three main waves (A, B, C). Repetition of these Elliott correction patterns in smaller and more detailed formats is also inevitable and occurs in most cases. In fact, falling waves are always against the main direction of the trend and somehow play the opposite instrument.
Five waves:
The first wave : in fact, the beginning of the movement is an upward trend in an accelerated manner. This wave is called the mafia wave due to the unknown movement dimensions and its causes, and no one knows anything about the trend.
The second wave : the wave in which buyers cash out their profits and the price decreases and the supply exceeds the demand.
The third wave : a wave belonging to all traders and normal market analysts, which is a powerful wave and forms the highest peak and the longest length.
Fourth wave : Like the second wave, the fourth wave is formed and the supply exceeds the demand.
The fifth wave : The wave that has made every non-professional and novice a professional. With the increase in prices in the past, non-professionals have been stimulated to buy and the price rises slowly in this wave.
It can also be said about the corrective triple waves that:
Wave A : After buying the profits that the big traders earned, they are cashing in their profits and the supply increases compared to the demand, and this supply can be fast at first.
Wave B : In most cases, with the price decrease in wave A, when the price has a significant drop, it stimulates a group of buyers to buy and causes the price to increase but slowly in this wave.
Wave C : With the price increase in wave B, which has been slow, it now creates fear for those traders who are in profit that the price may be bearish. Therefore, people who have not cashed their profits in the past start cashing their profits, which causes the price to decrease and the formation of wave C.
The fifth section
Indicator patterns
Among the very powerful patterns with the help of the indicator, divergences can be called “Divergence”. Divergences are divided into two main categories.
1- “Regular Divergence” which is abbreviated as RD.
2- “Hidden Divergence” and is usually displayed as an abbreviation with HD.
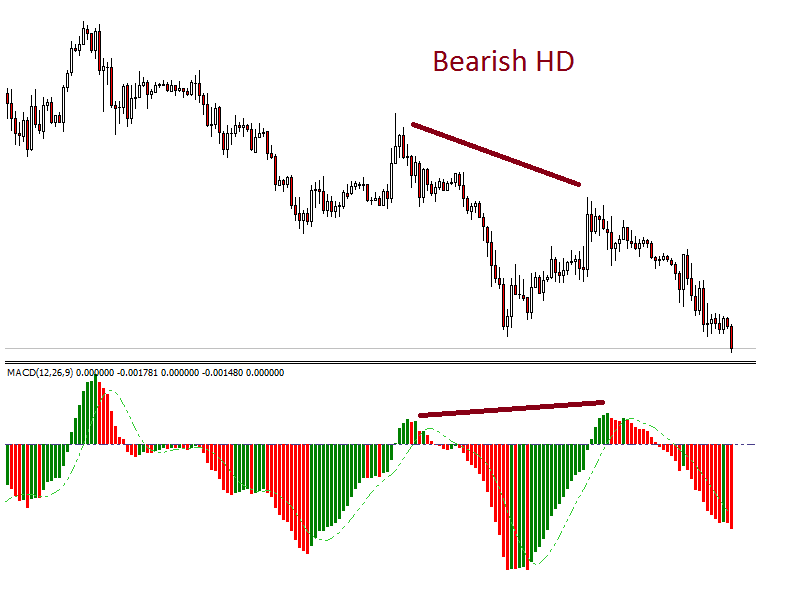
Indicator patterns
In the picture above, the hidden bearish divergence pattern is displayed. This pattern is formed in the heart of a price trend and is a sign of the continuation of the price trend.
Result:
Finding a way to accurately predict price movements is always one of the main needs of traders. Considering the types of patterns in technical analysis, we can conclude that in the forex market, the use of these patterns as analytical tools is very important. Classical price patterns can help us identify patterns such as head and shoulders, triangles and flags and thus predict the direction of price movement. Candlestick patterns also provide important information, as each type of candlestick can indicate price changes and market trends. Harmonic patterns and Elliott waves also help us to recognize more complex patterns in the market and by using these analyses, we can better predict the future direction of the price movement. Finally, indicator patterns can provide us with useful information about market strength and direction. Therefore, intelligent use of these patterns and their combination can help us make successful decisions in the forex market.