Teaching supply and demand in forex
Introduction:
The forex market, as one of the largest financial markets in the world, is influenced by several factors, including the concept of supply and demand. In this article, focusing on the concept of supply and demand, an example of the analysis of these two factors in the forex market is provided. The purpose of this analysis is to inspire traders and investors who seek to better understand market behavior and make intelligent decisions.
First part: Understanding supply and demand:
In the forex market, supply and demand are the two main forces that determine prices. Supply represents the total number of currencies or currency pairs that are available for sale at a particular time. Demand refers to the total number of currencies or currency pairs that are available for purchase at a given time. When demand is greater than supply, prices rise and vice versa.
One of the most basic concepts in the forex market is the concept of supply and demand, which determines how much assets or stocks are offered in financial markets. In other words, supply and demand is the most important component in the financial market that affects the asset price. Price movements in financial markets are the result of supply and demand.
Supply The concept of supply in the financial market means how much of an asset or stock is offered in the market.
Demand The concept of demand in the financial market means that traders are willing to buy how much of a stock or asset.
When in the financial markets, the demand for an asset or stock, such as a currency pair, increases, it causes the price of that asset to increase, but when the supply for a stock or asset increases, it causes the price of that asset to decrease. In this way, the amount of demand and supply affects price movements in financial markets. When the amount of supply and demand in the financial market is balanced, price movements will face small fluctuations.
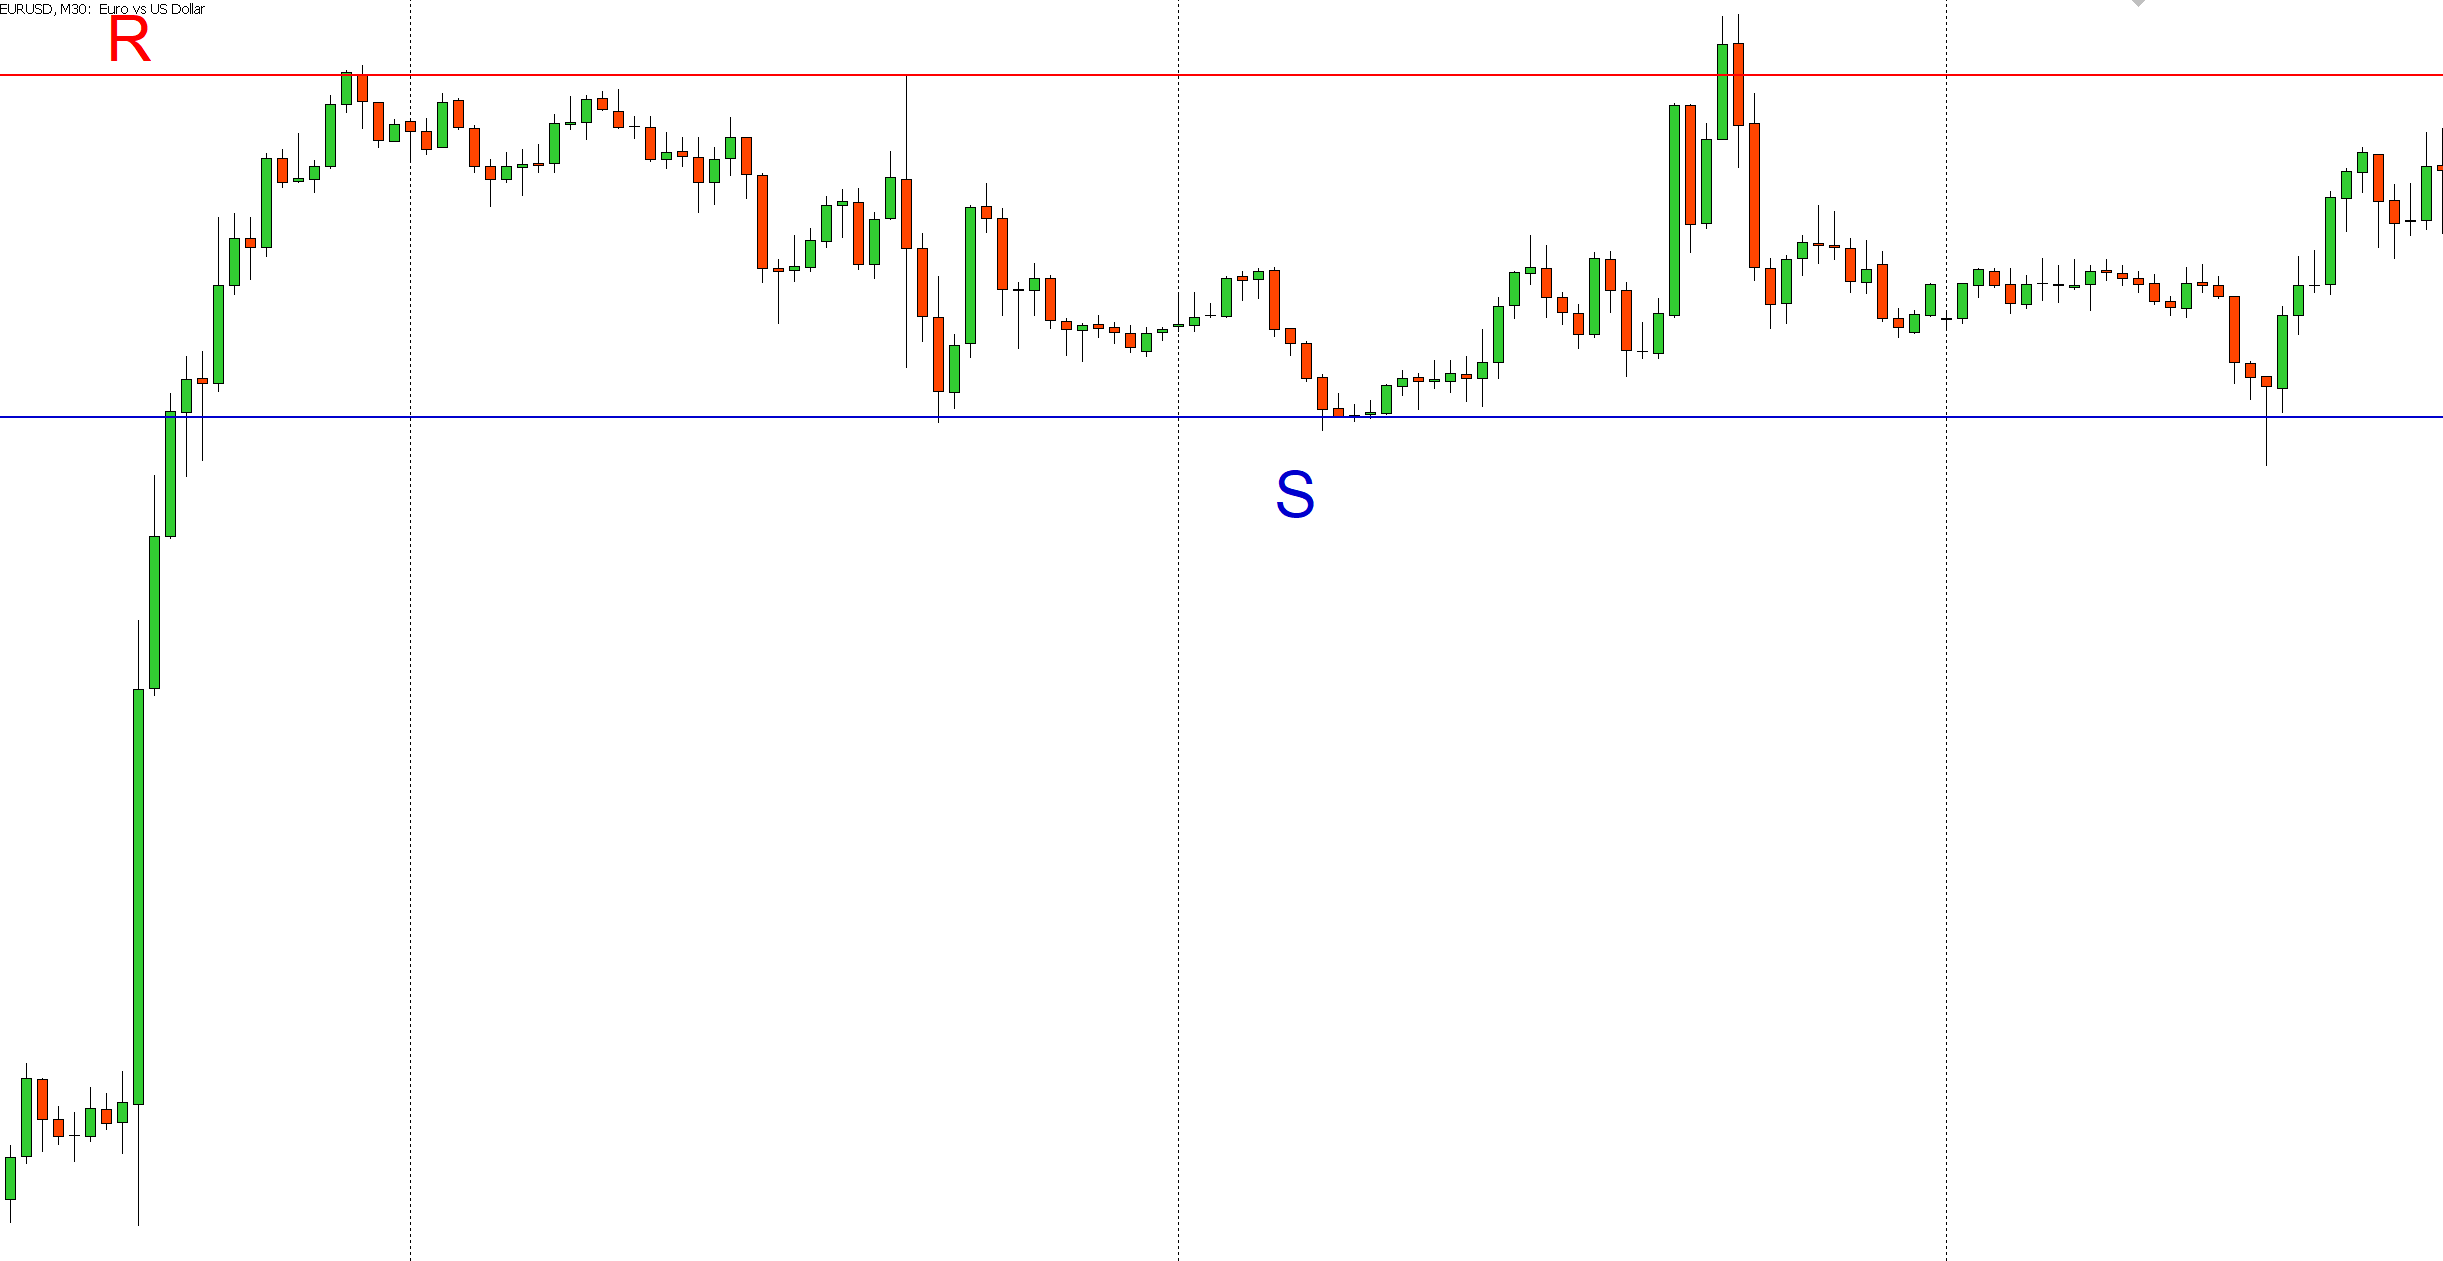
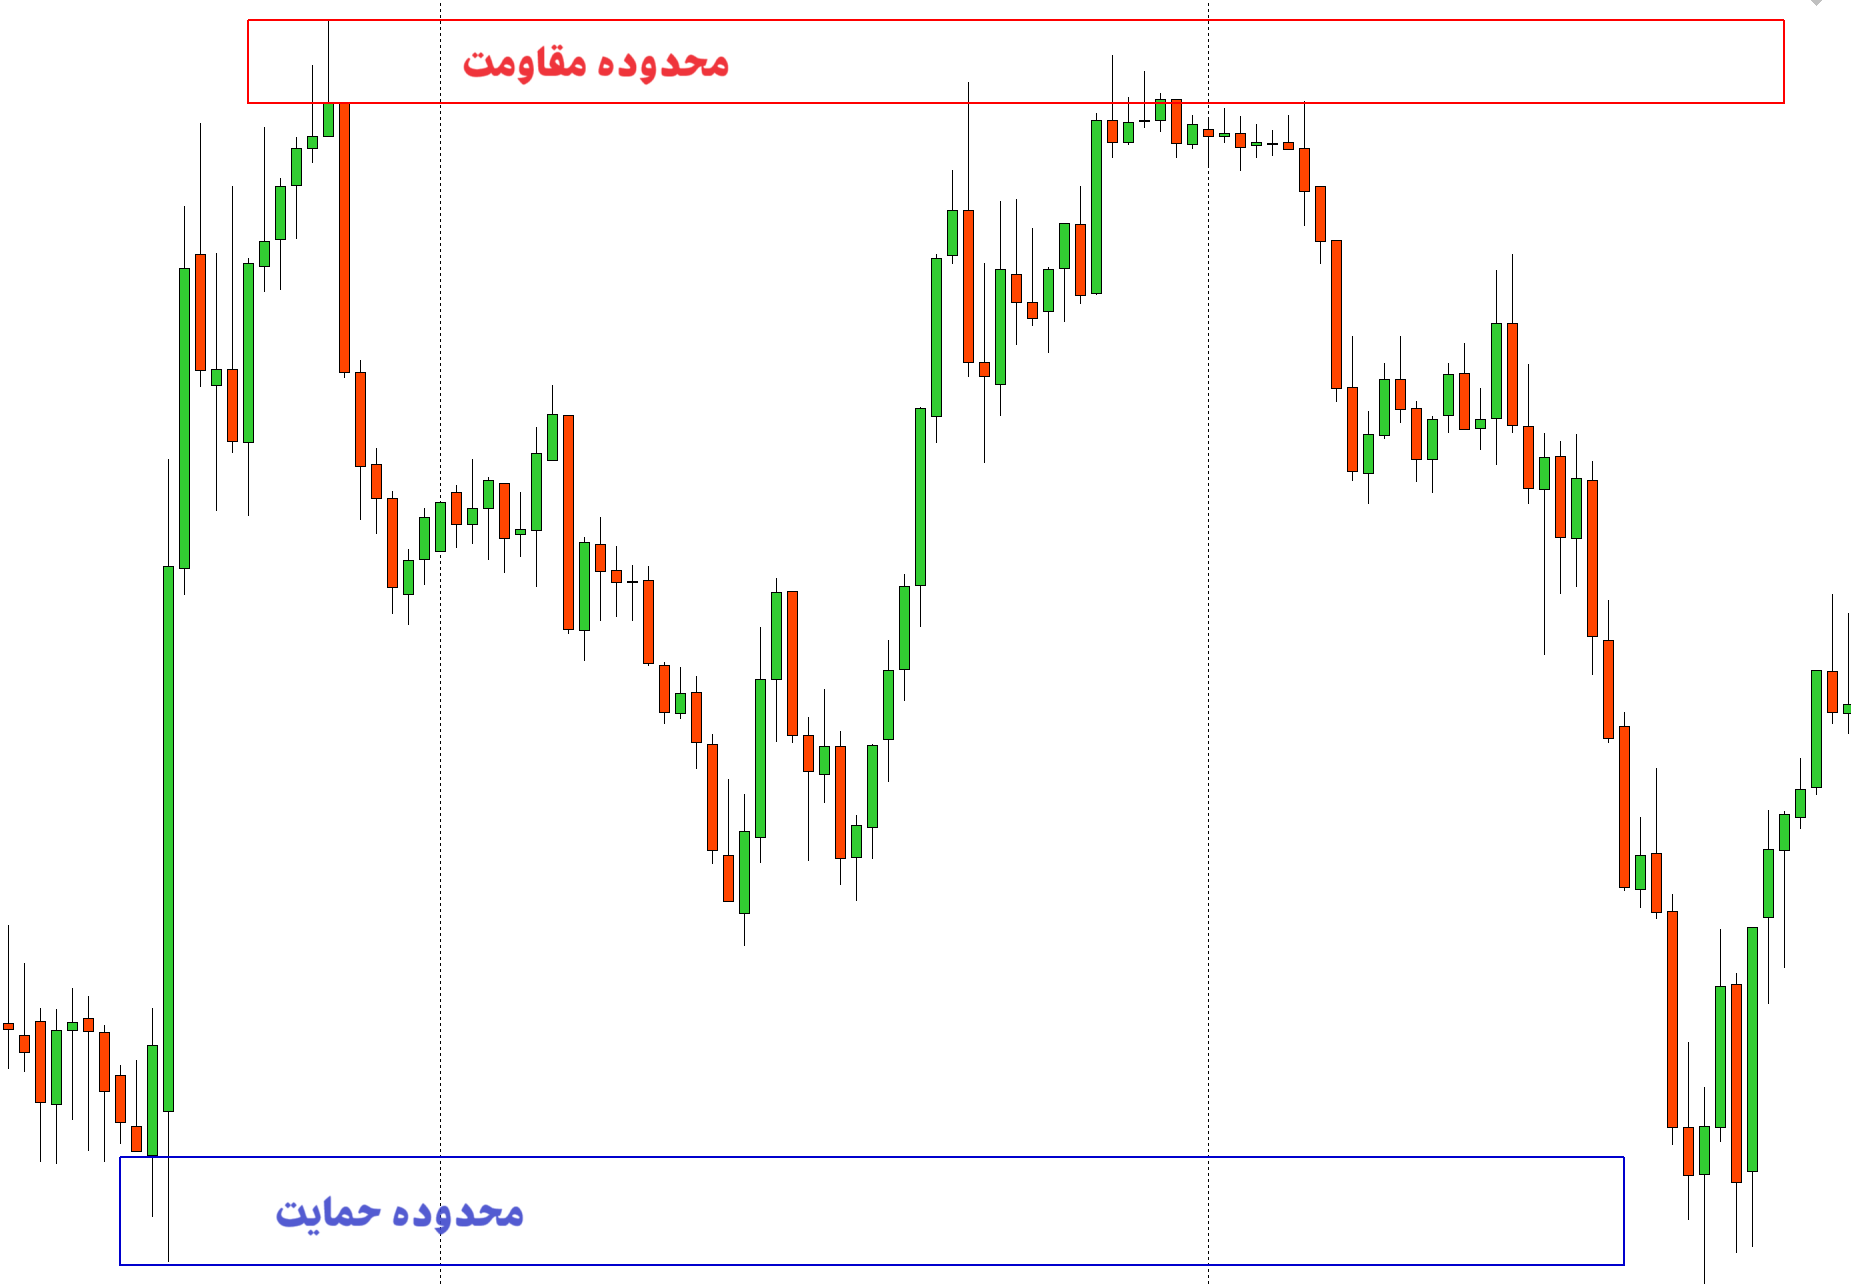
In the financial markets and especially in the currency or forex market, supply and demand levels are terms that refer to specific points on the price chart of a currency or other asset. These levels are points that may affect price behavior. Understanding these levels may help the technical analyst and guide financial trading decisions. The following is an explanation of supply and demand levels in forex:
Demand Level:
The demand level is the point on the chart where the price is relatively lower than before and more buyers are likely to be willing to buy. When the price reaches a demand level, demand is expected to increase and the price is likely to move higher.
Supply Level:
A supply level is a point on the chart where the price is relatively high and more sellers may be willing to sell. When the price reaches a supply level, the supply is expected to increase and the price is likely to move lower.
Dealing with levels (Level Interaction):
When the price reaches the demand level, if the demand is strong, it may cause this level to be hit and the price will rise. Also, when the price reaches the supply level, if the supply is strong, it may cause the price to hit this level and fall.
Breakout and Pullback:
If the price crosses a supply or demand level, this may be known as a “breakout”. Then, possibly (due to the buyers cashing out some of their profits) a “retracement” occurs where the price returns to the previous level, which we consider as a new level for analysis.
Overall, supply and demand analysis helps traders improve possible entry and exit points in the forex market. However, these analyzes may not always be successful and traders should consider other factors in making trading decisions.
Range-bound Levels:
At times, the market may be in a range between a demand level and a supply level. In this case, traders may pay attention to the boundary points of this range and expect the price to move within this range.
Timing:
Timing also plays an important role in analyzing supply and demand levels. Usually, the stronger and more influential a demand or supply level is, the better the timing to enter or exit a trade.
Using indicators and patterns:
In analyzing supply and demand levels, traders may use indicators and analytical patterns such as support and resistance, moving averages, and candlestick patterns to confirm or change their decisions.
Risk Management:
In any business, risk management is very important. Traders must include a certain amount of capital in each trade and use risk management tools, such as stop-loss orders.
- Effects of Economic Factors: There are important economic factors that affect supply and demand in the forex market. For example, an increase in the unemployment rate may decrease the demand for the currency because fewer people have the purchasing power. Also, economic growth can increase demand.
- Technical analysis: Technical analysis is an important tool in the analysis of supply and demand in the forex market. Price charts, technical indicators, and price patterns provide information that helps traders identify market strengths and weaknesses and make appropriate decisions.
- Political events: Political events can also affect supply and demand. Political decisions, economic statistics, or even developments in diplomacy can cause sudden changes in any type of market.
- Fundamental analysis: Fundamental analysis helps to make decisions by studying economic, social, and political information. This type of analysis can help the trader to determine the best time to enter or exit the market.
Trading strategy:
Based on the aforementioned analyses, a trading strategy may include a combination of technical and fundamental analysis. For example, if the technical analysis shows strong points in the charts and also the fundamental analysis shows positive information, the decision to enter the market is made.
The second part: Teaching supply and demand strategy in forex
In this section, we discuss supply and demand areas in forex without indicators and with price movements
Knowing supply and demand in the prices of liquidity pools and important levels
At important and influential supply and demand levels, when the price approaches the supply level, the demand for buying should decrease and the price will rise with erosion, and the steps that are formed in the candlestick in the trading chart with a small visible body will be This indicates a decrease in the demand for purchase, and probably the buyers who were buying at the bottom of the price, when the price reaches the resistance level, they cash out the profit and wait for the price to lose the buying potential at this level. And if the price does not have the ability to break out of the resistance level, the supply will be formed in the market and the sellers will enter the sale transaction, by selling at this price level, the supply will increase.
Note: It should be noted that at the supply and demand levels, sometimes the price exceeds the resistance or support level and touches the stops of retail traders, and then the main sale begins. This range above the resistance is called “liquidity pool” and traders must be very careful in this range.
In the figure below, the price has caused the price to fall in this range by hitting the resistance level that was created the previous day with a candle with a long candlestick and a candle with a bearish Ingolf candle. The reason for the fall in ascending candles is quite clear and visible. Bullish candles show that buyers do not show much desire to buy in this range.
Time 30 minutes:
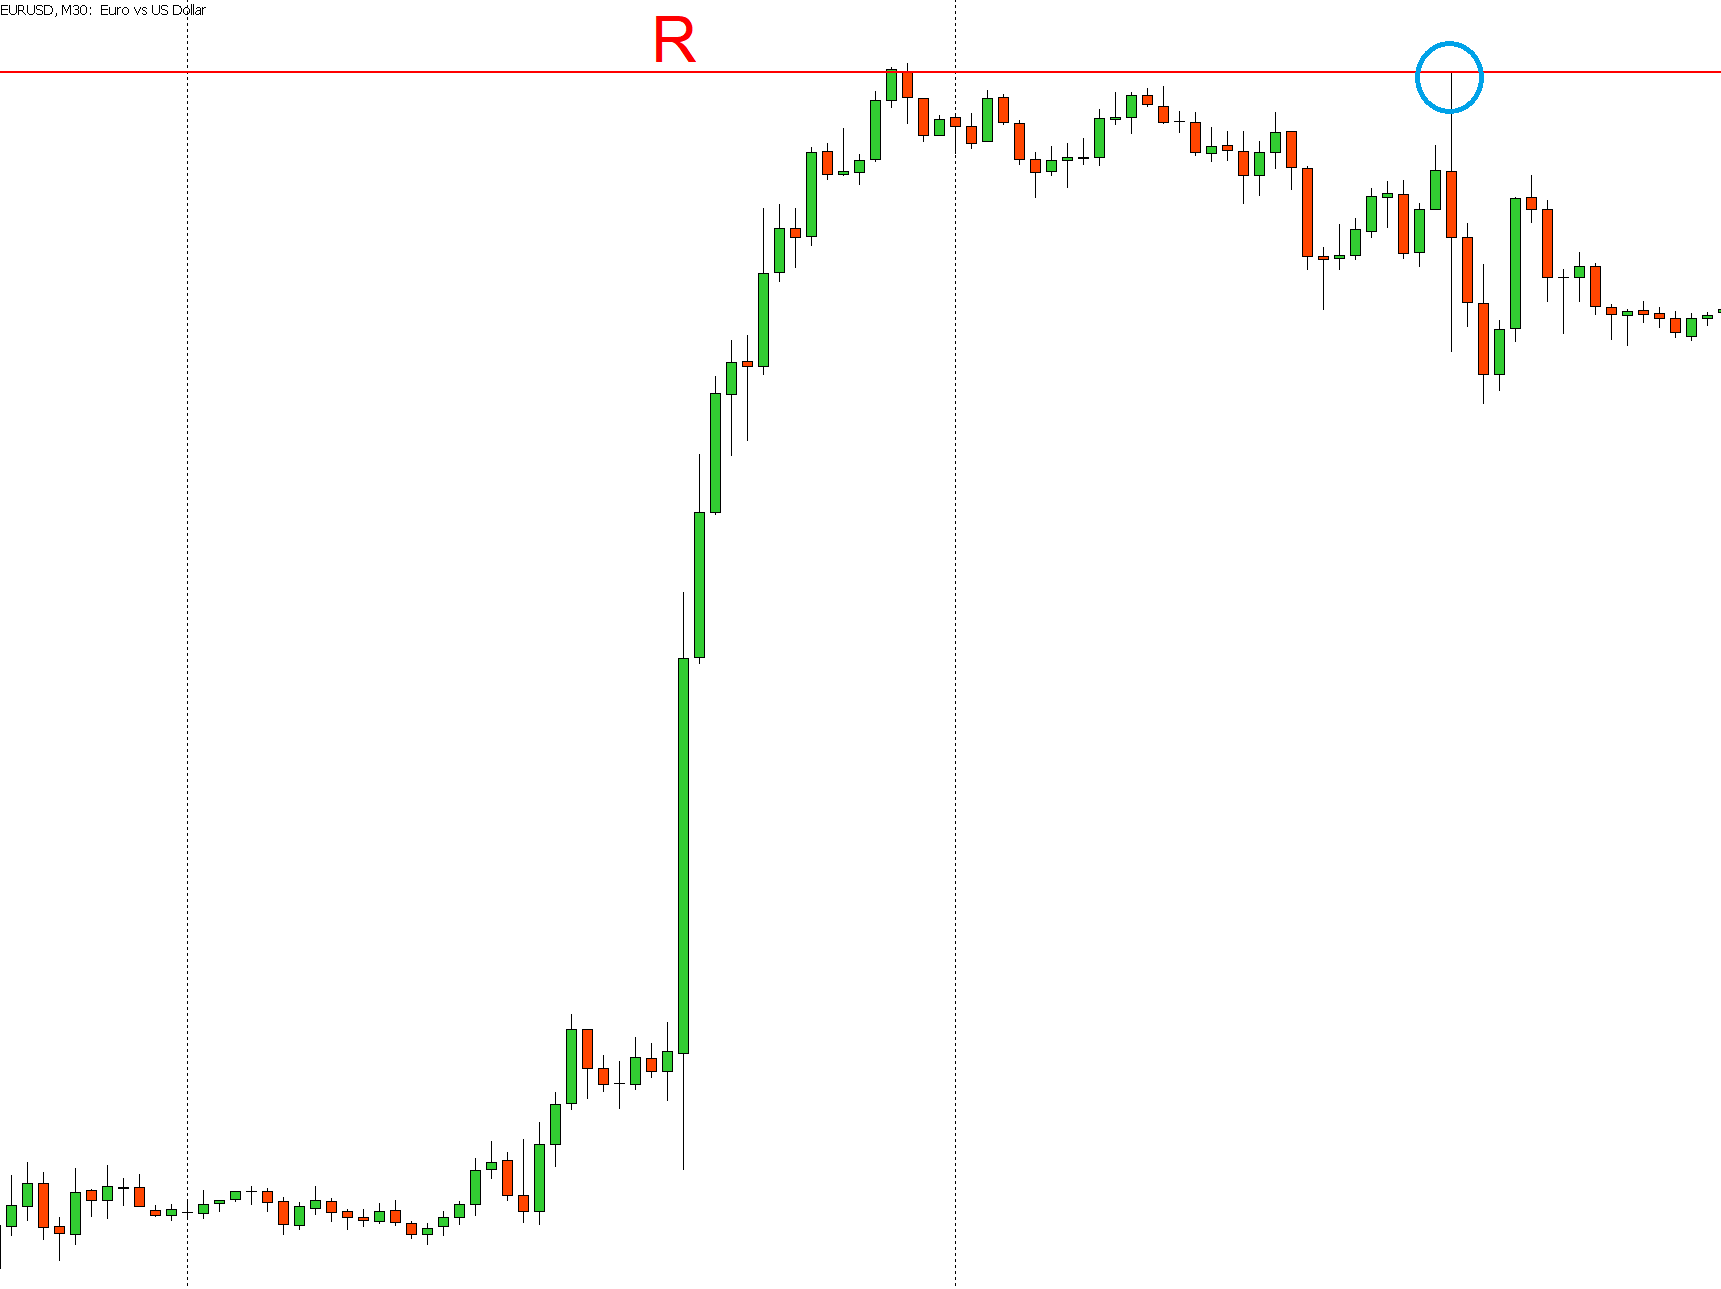
Time 30 minutes
Time 1 minute:
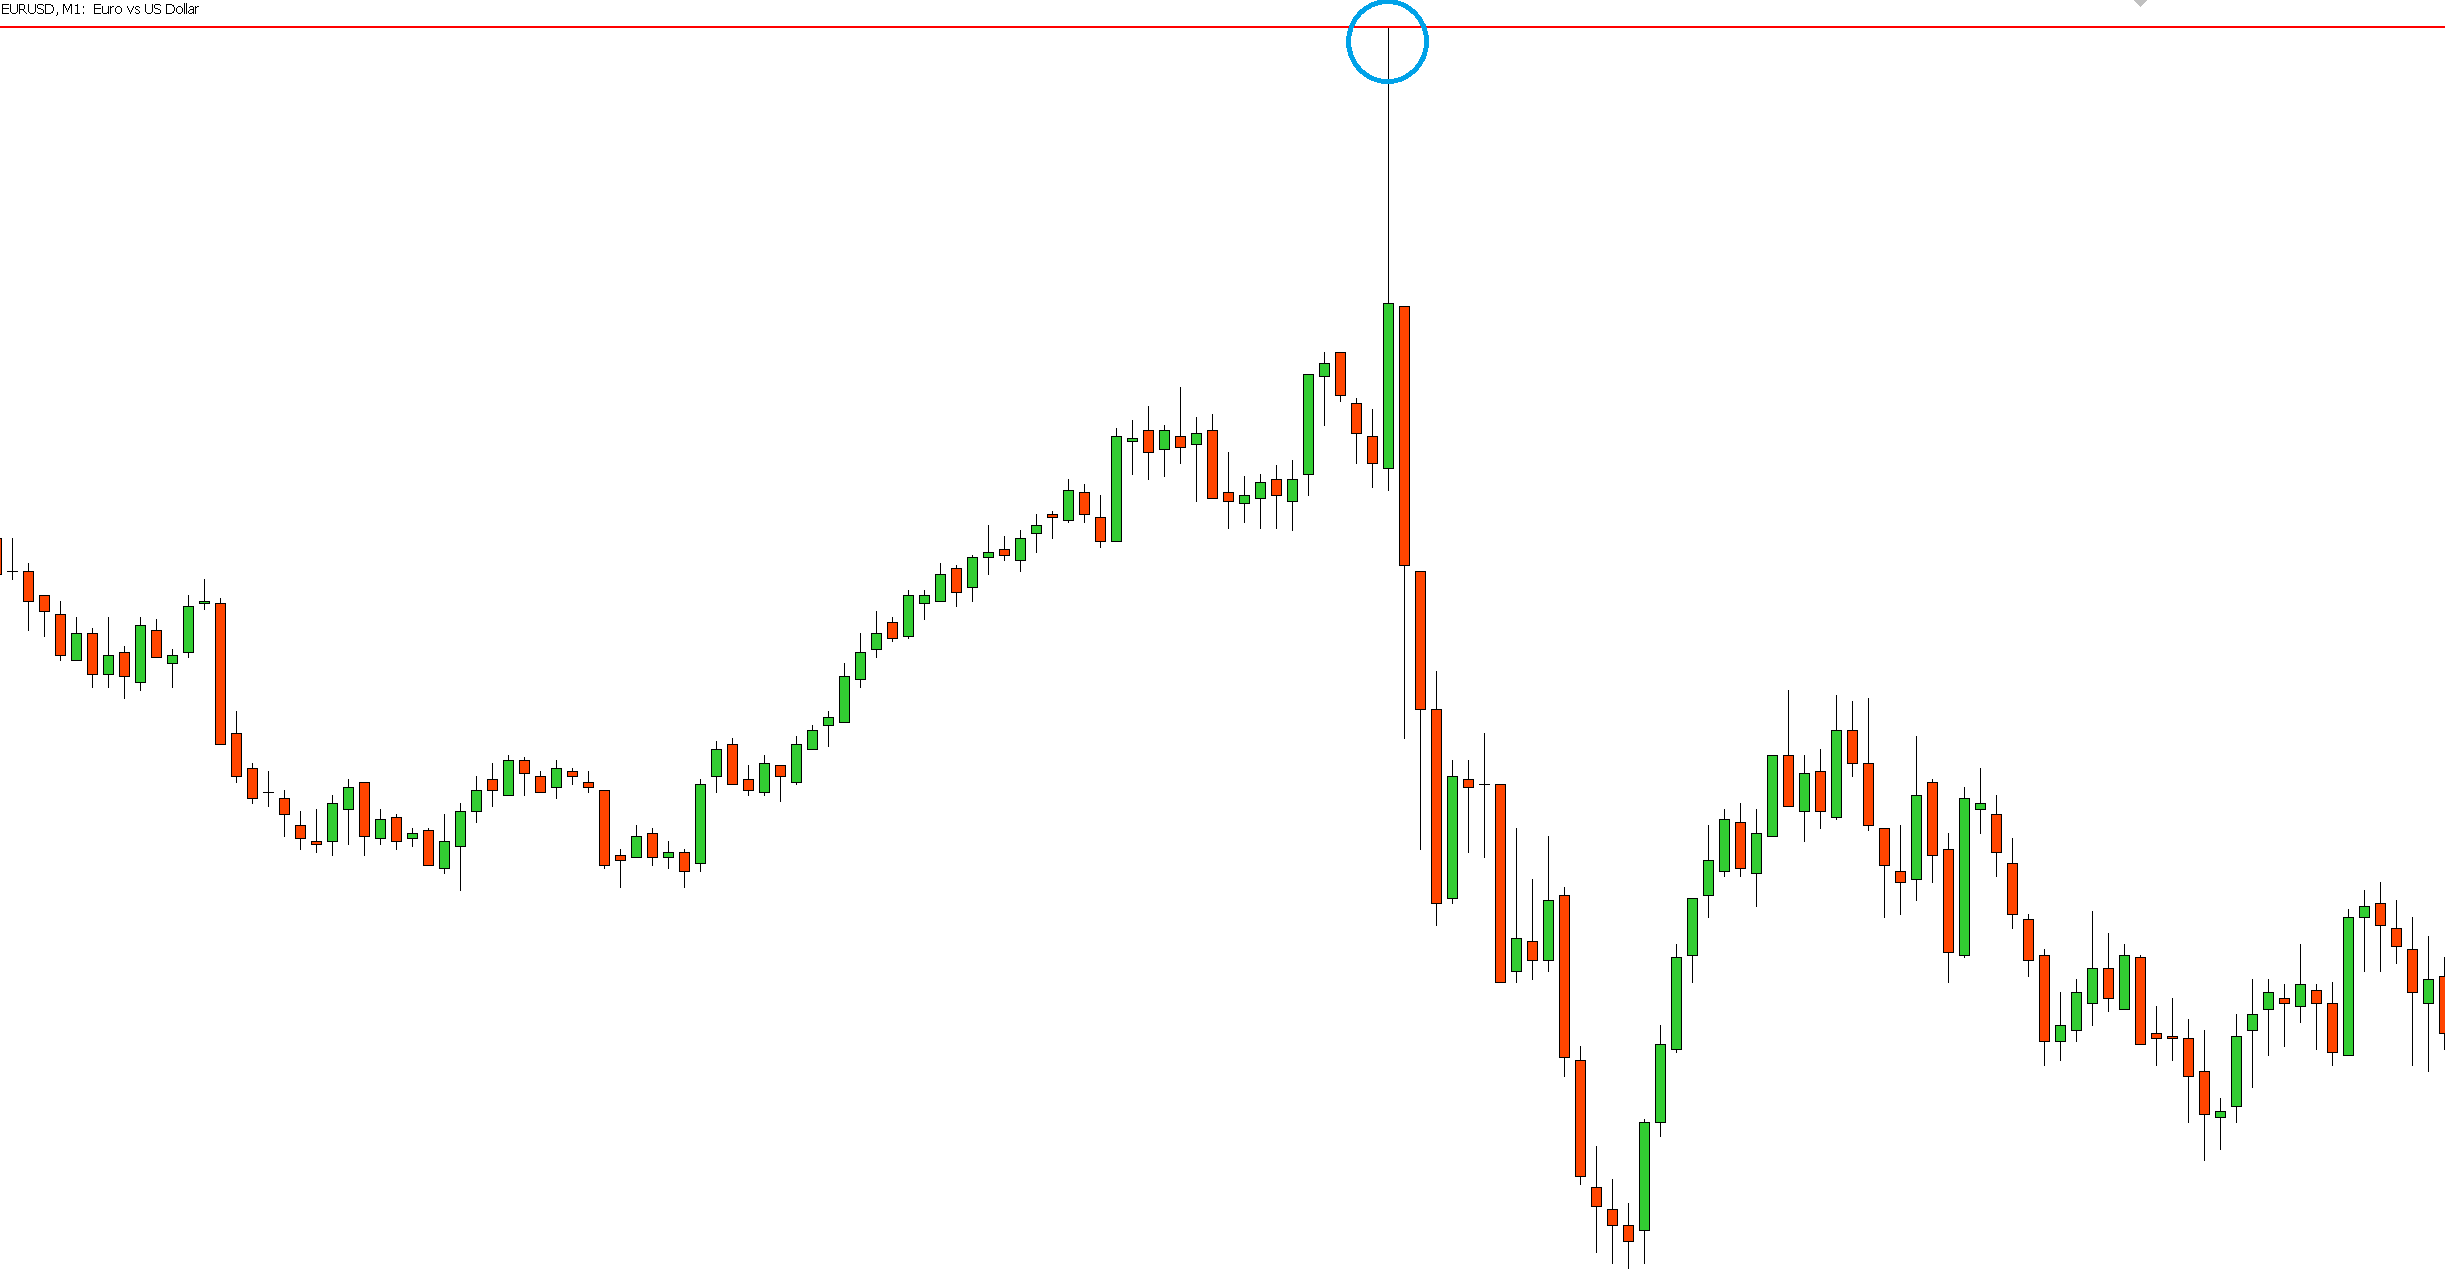
Time 1 minute
Now in the picture below, you can see that the price rises to the resistance level again and shows some decline, which probably suggests that the big market leaders encourage retail traders to sell, and with the price increase and the resistance level breaking out, the stops Traders collect small and then enter the main selling transaction.
Half hour time:
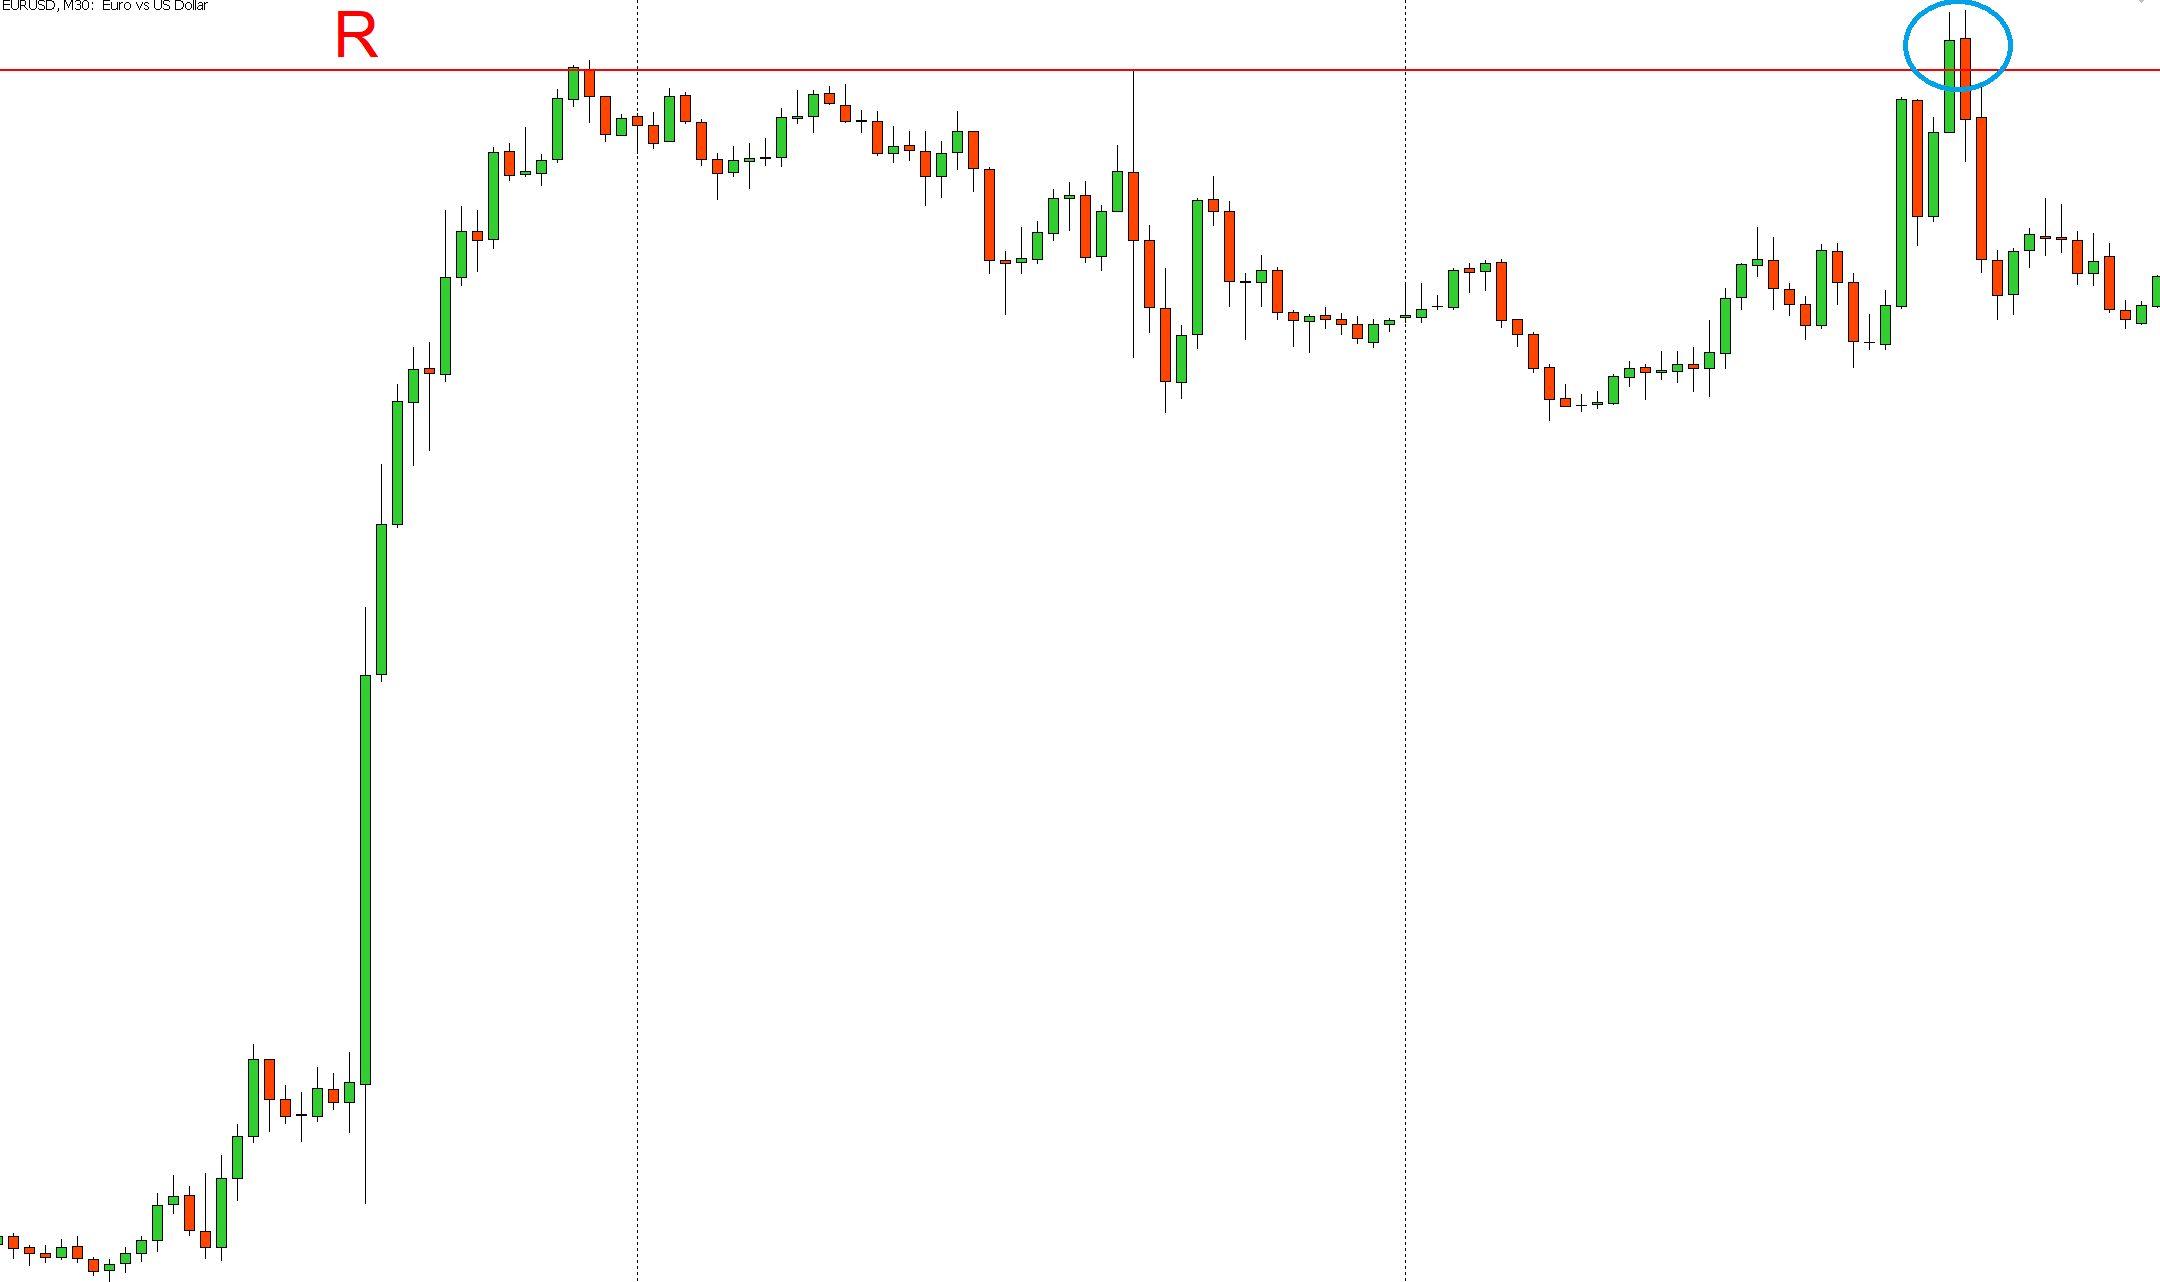
Half an hour time
Time 1 minute:
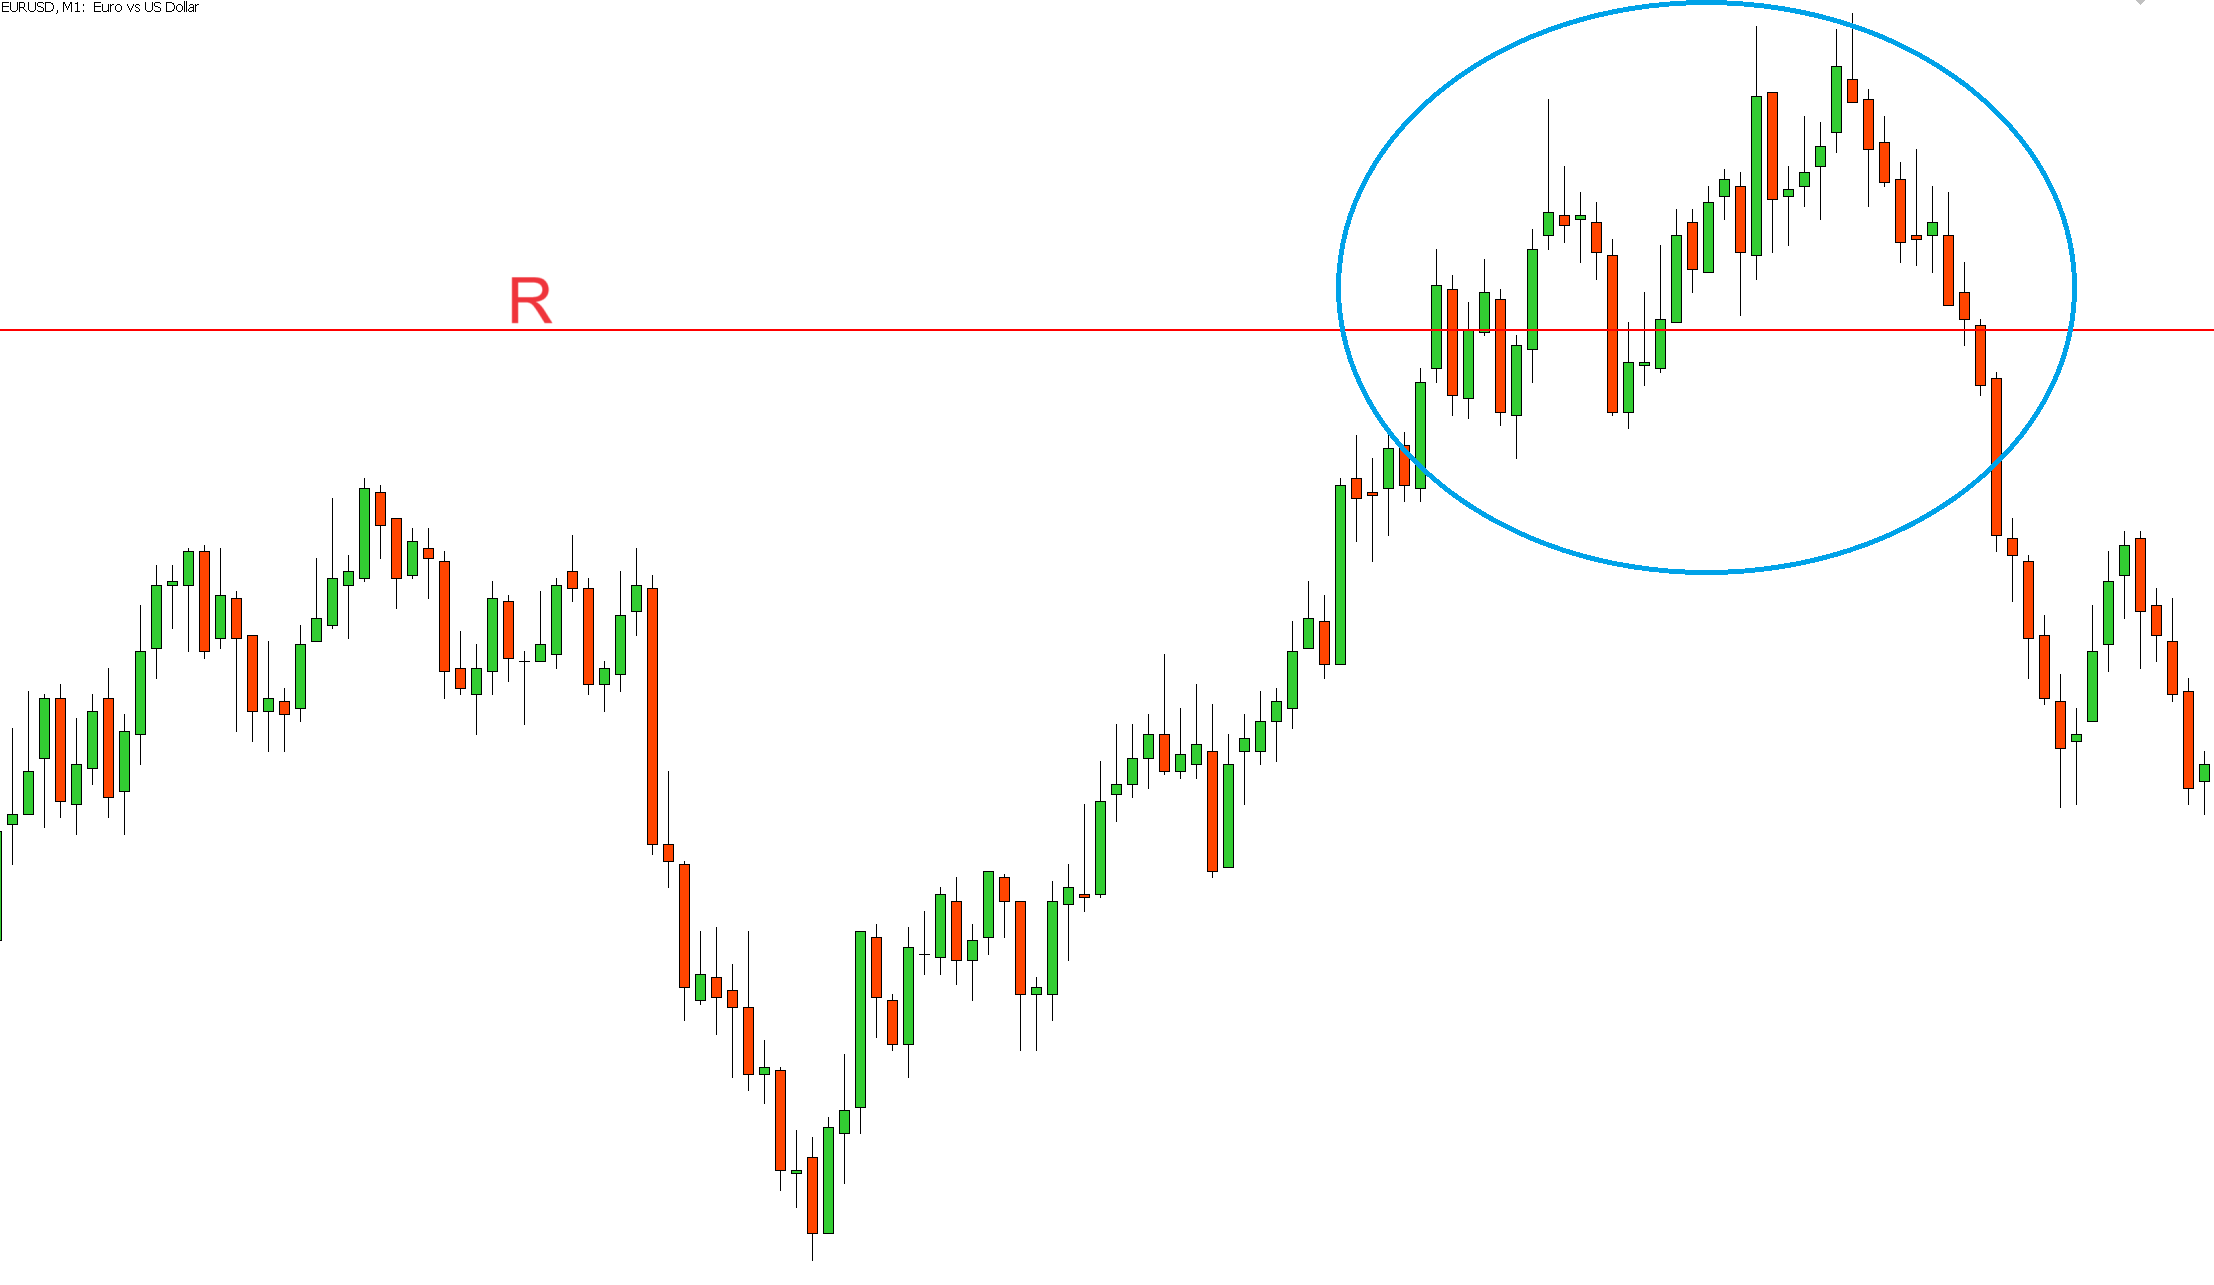
Time 1 minute
Draw supply and demand levels in general:
1- Recognizing the level of resistance and support:
To determine the level of resistance and support, we use the time of 30 minutes and draw lines from the body of the candle. Traders who trade in higher time can get help from levels 1, 4 and daily, but daily traders or (Day Trade) should get help from half hour level to determine the levels.
Detection of resistance and support levels
2- Range of resistance and support level:
To determine the price range, we take help from the range of the candle shade to the body of the candle.
Range of resistance and support levels
These areas were displayed for important and main levels that play an important role in creating the price path, and you can also use the volume tool for high and low volume levels that are supply and demand levels.
Intermediate levels where pullbacks are usually formed, and in addition to this, by specifying the highest price volume of the previous wave (poc) or without the volume tool with the opposite candle on the way back, the supply range and the gap between the main levels specified
Conclusion
Analyzing supply and demand in the forex market requires a deep understanding of economic concepts and market analysis. Using technical and fundamental analysis along with a detailed understanding of economic and political factors can help traders make the best decisions for profitability. Also, paying attention to the sample of past analyzes (backtest) and understanding the principles of supply and demand allows traders to develop more successful strategies in the forex market.