NDS Strategy in Forex
Introduction:
Mathematics, as the foundation of any scientific discipline, currently plays a very fundamental role in financial markets. In these markets, each price movement is formed by one or more polynomials in mathematics, which change the coefficients of these polynomials through the volume of transactions in each trading round. These changes lead to the formation of different forms in the market. Imagine that an upward movement in the market, a small correction and finally an upward spike (fast movement) forms a flag. These three movements are developed as a polynomial in mathematics with the factor of time, and as a result, over time, there are multiple values that are chained together. In the market, each cycle or “cycle” has a lifetime, and larger cycles have a longer lifetime than smaller cycles. Smaller cycles are born and die so that bigger cycles are born and die and the cycle continues. As a trader in this environment, you are in the middle of this cycle of evolution to determine which major cycles are alive and active, and which smaller cycles are dead or reborn. These phenomena are part of the beauty of nature and the nature of the financial market. This evolutionary system was proposed for the first time in the world by Dr. Fawzi Logic.
Introducing the NDS trading strategy
The purpose of this article is to introduce the powerful strategy of NDS or Nodal Displacement Sequencing.
The NDS trading style is divided into five general bases and three main bases: The first base of Fractal Analysis is the top of this pyramid, which looks at the market from top to bottom, where higher time frames affect lower time frames, and lower time frames work hand in hand to create higher time frames. do
In the second base, Cycle Analysis, we will deal with all types of cycles and discuss their elements. The third base is called Symmetry. Symmetry is one of the main pillars of aesthetics and visual features that can be seen in all natural forms. A clear example of it can be mentioned in the human body, such as two eyes, two ears, two arms, and it is equally visible in animals and plants. Symmetry is also widely used in ancient architecture as well as modern architecture.
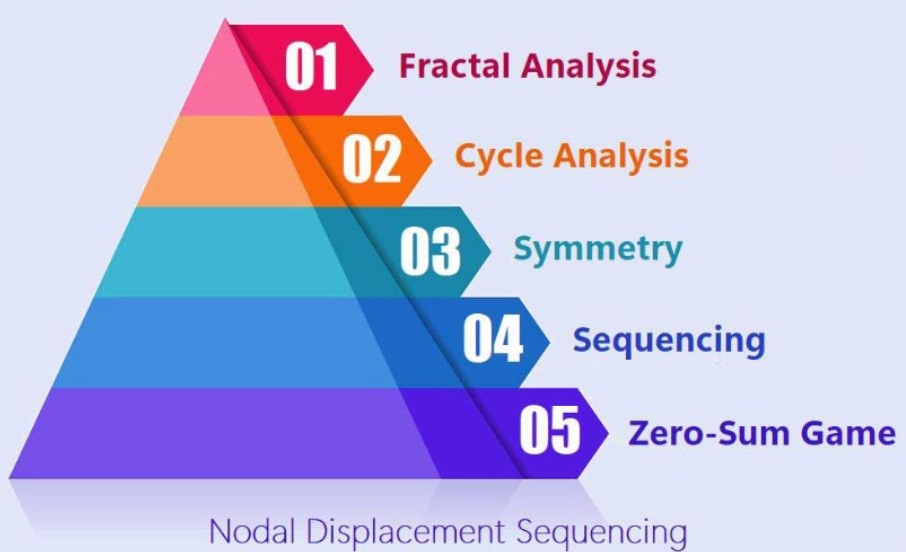
The fourth base is called Sequencing, which is the central core and the main base of the NDS strategy, the other bases are auxiliary tools and help the fourth base, which is Sequencing. In this base, the sequence of nodes is being formed one after the other, and it implies the principle of sequence 123, which are done in order, so it is very useful in the market.
The fifth base Zero-Sum Game is a mathematical model of a situation where the profit or loss of one participant is exactly balanced by the losses or gains of other participants.
Cyclical analysis in trading style NDS
This cycle happens cyclically or periodically in financial markets. These cycles are constantly repeated in the market, but because apart from the price dimension, we also have the dimensions of time and volume, they will not always have the same pattern. From now on, we will say that the market consists of three general dimensions: price, time and volume. In every trading session, due to the variable flow of orders in the market, sometimes we will have cycles that are very different from each other. To master these cycles, you must always practice mentally and get your eyes used to these patterns Pay cycles.
Positive and negative cycles in NDS trading style
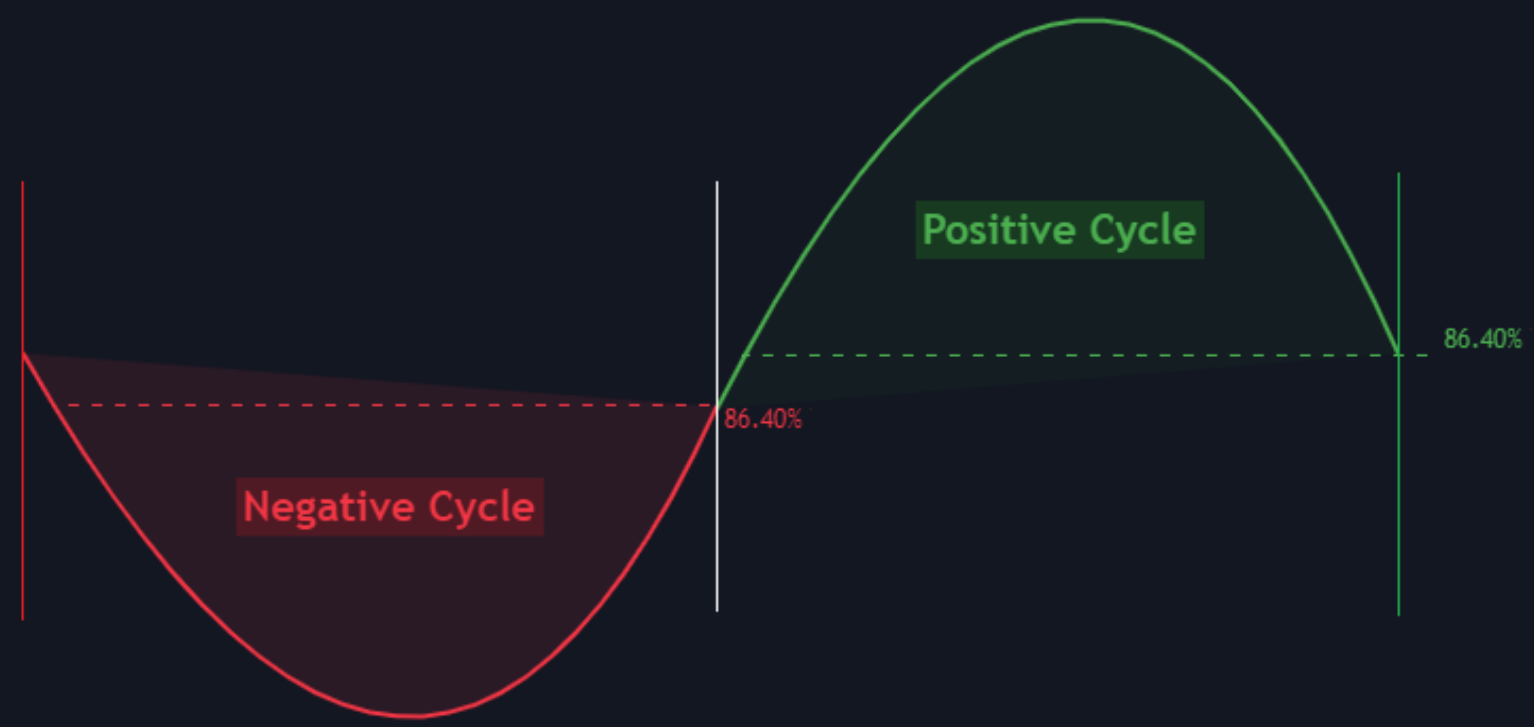
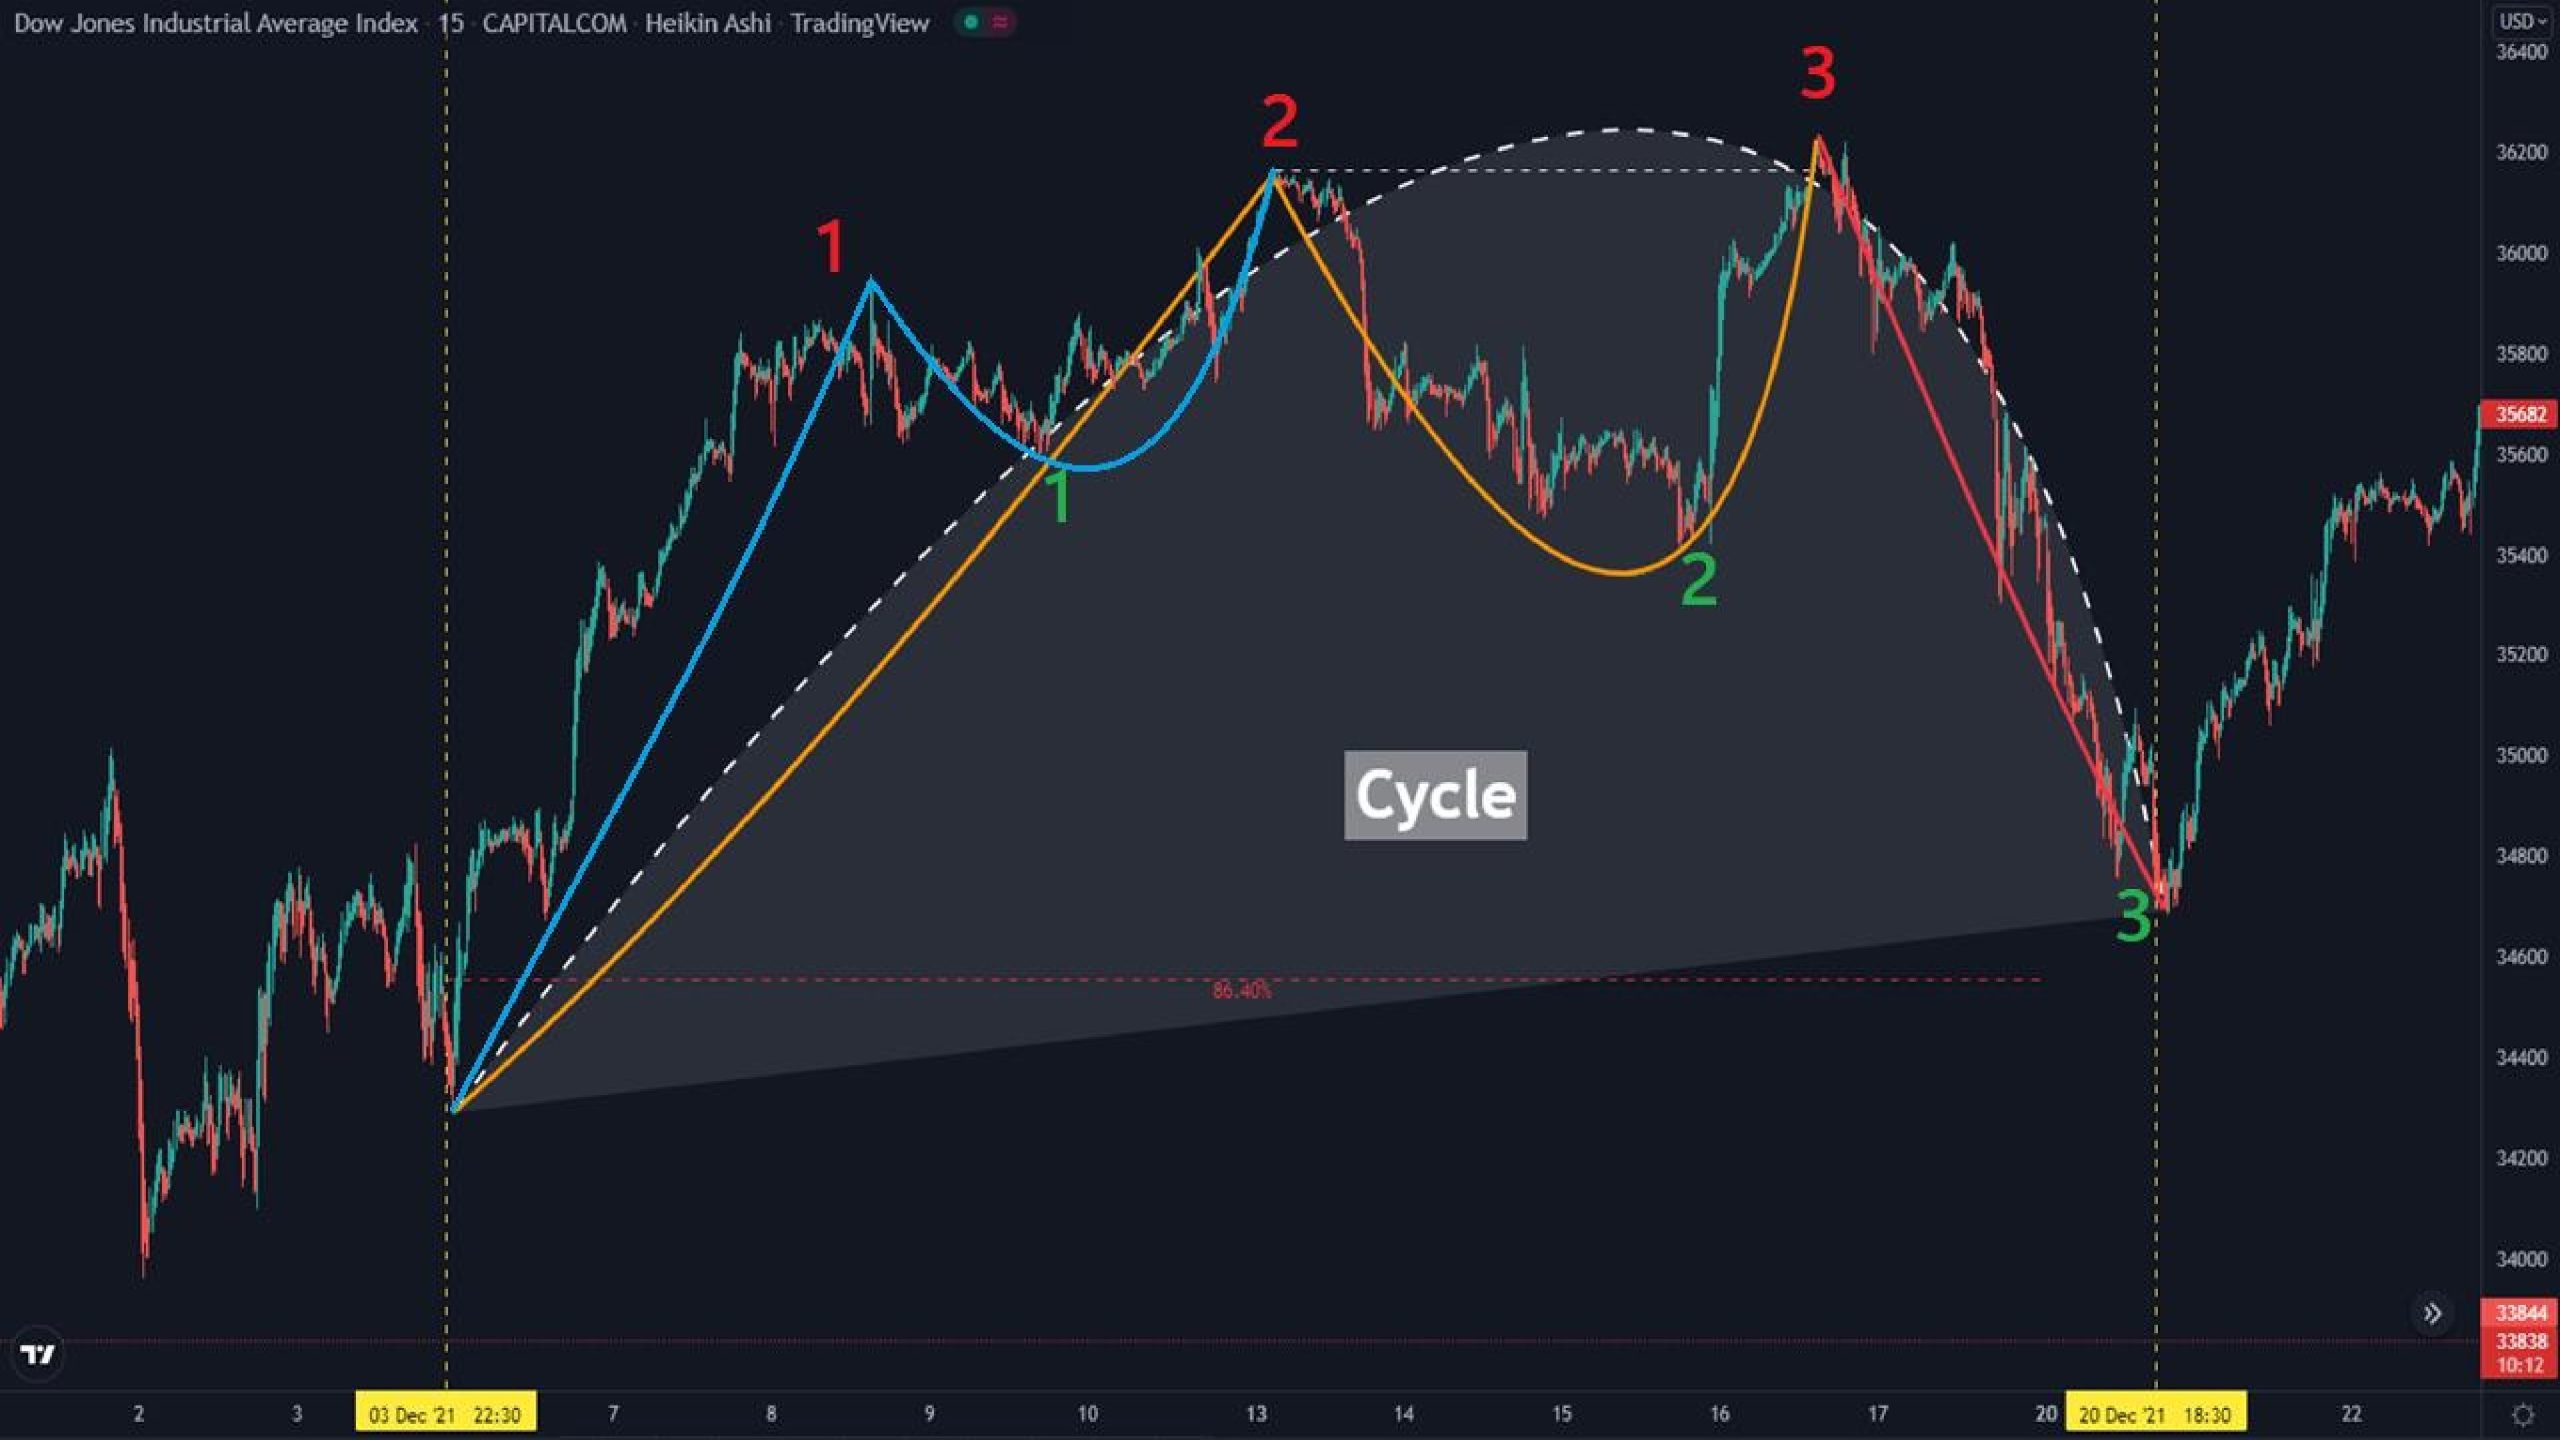
As you can see in the figure below, the market started to fall in the red vertical line, after 86.4% of its fall, it returned to the top and in the white vertical line, the cycle is closed, we call this negative cycle. In the following, you can see that from the vertical white line, the price has climbed up and then returned to the bottom up to 86.4% of the previous climb and the cycle is closed, we call incycle, positive cycle. Each cycle, both negative and positive, consists of four smaller patterns and contains them. A cycle that is still open is called an Active Cycle.
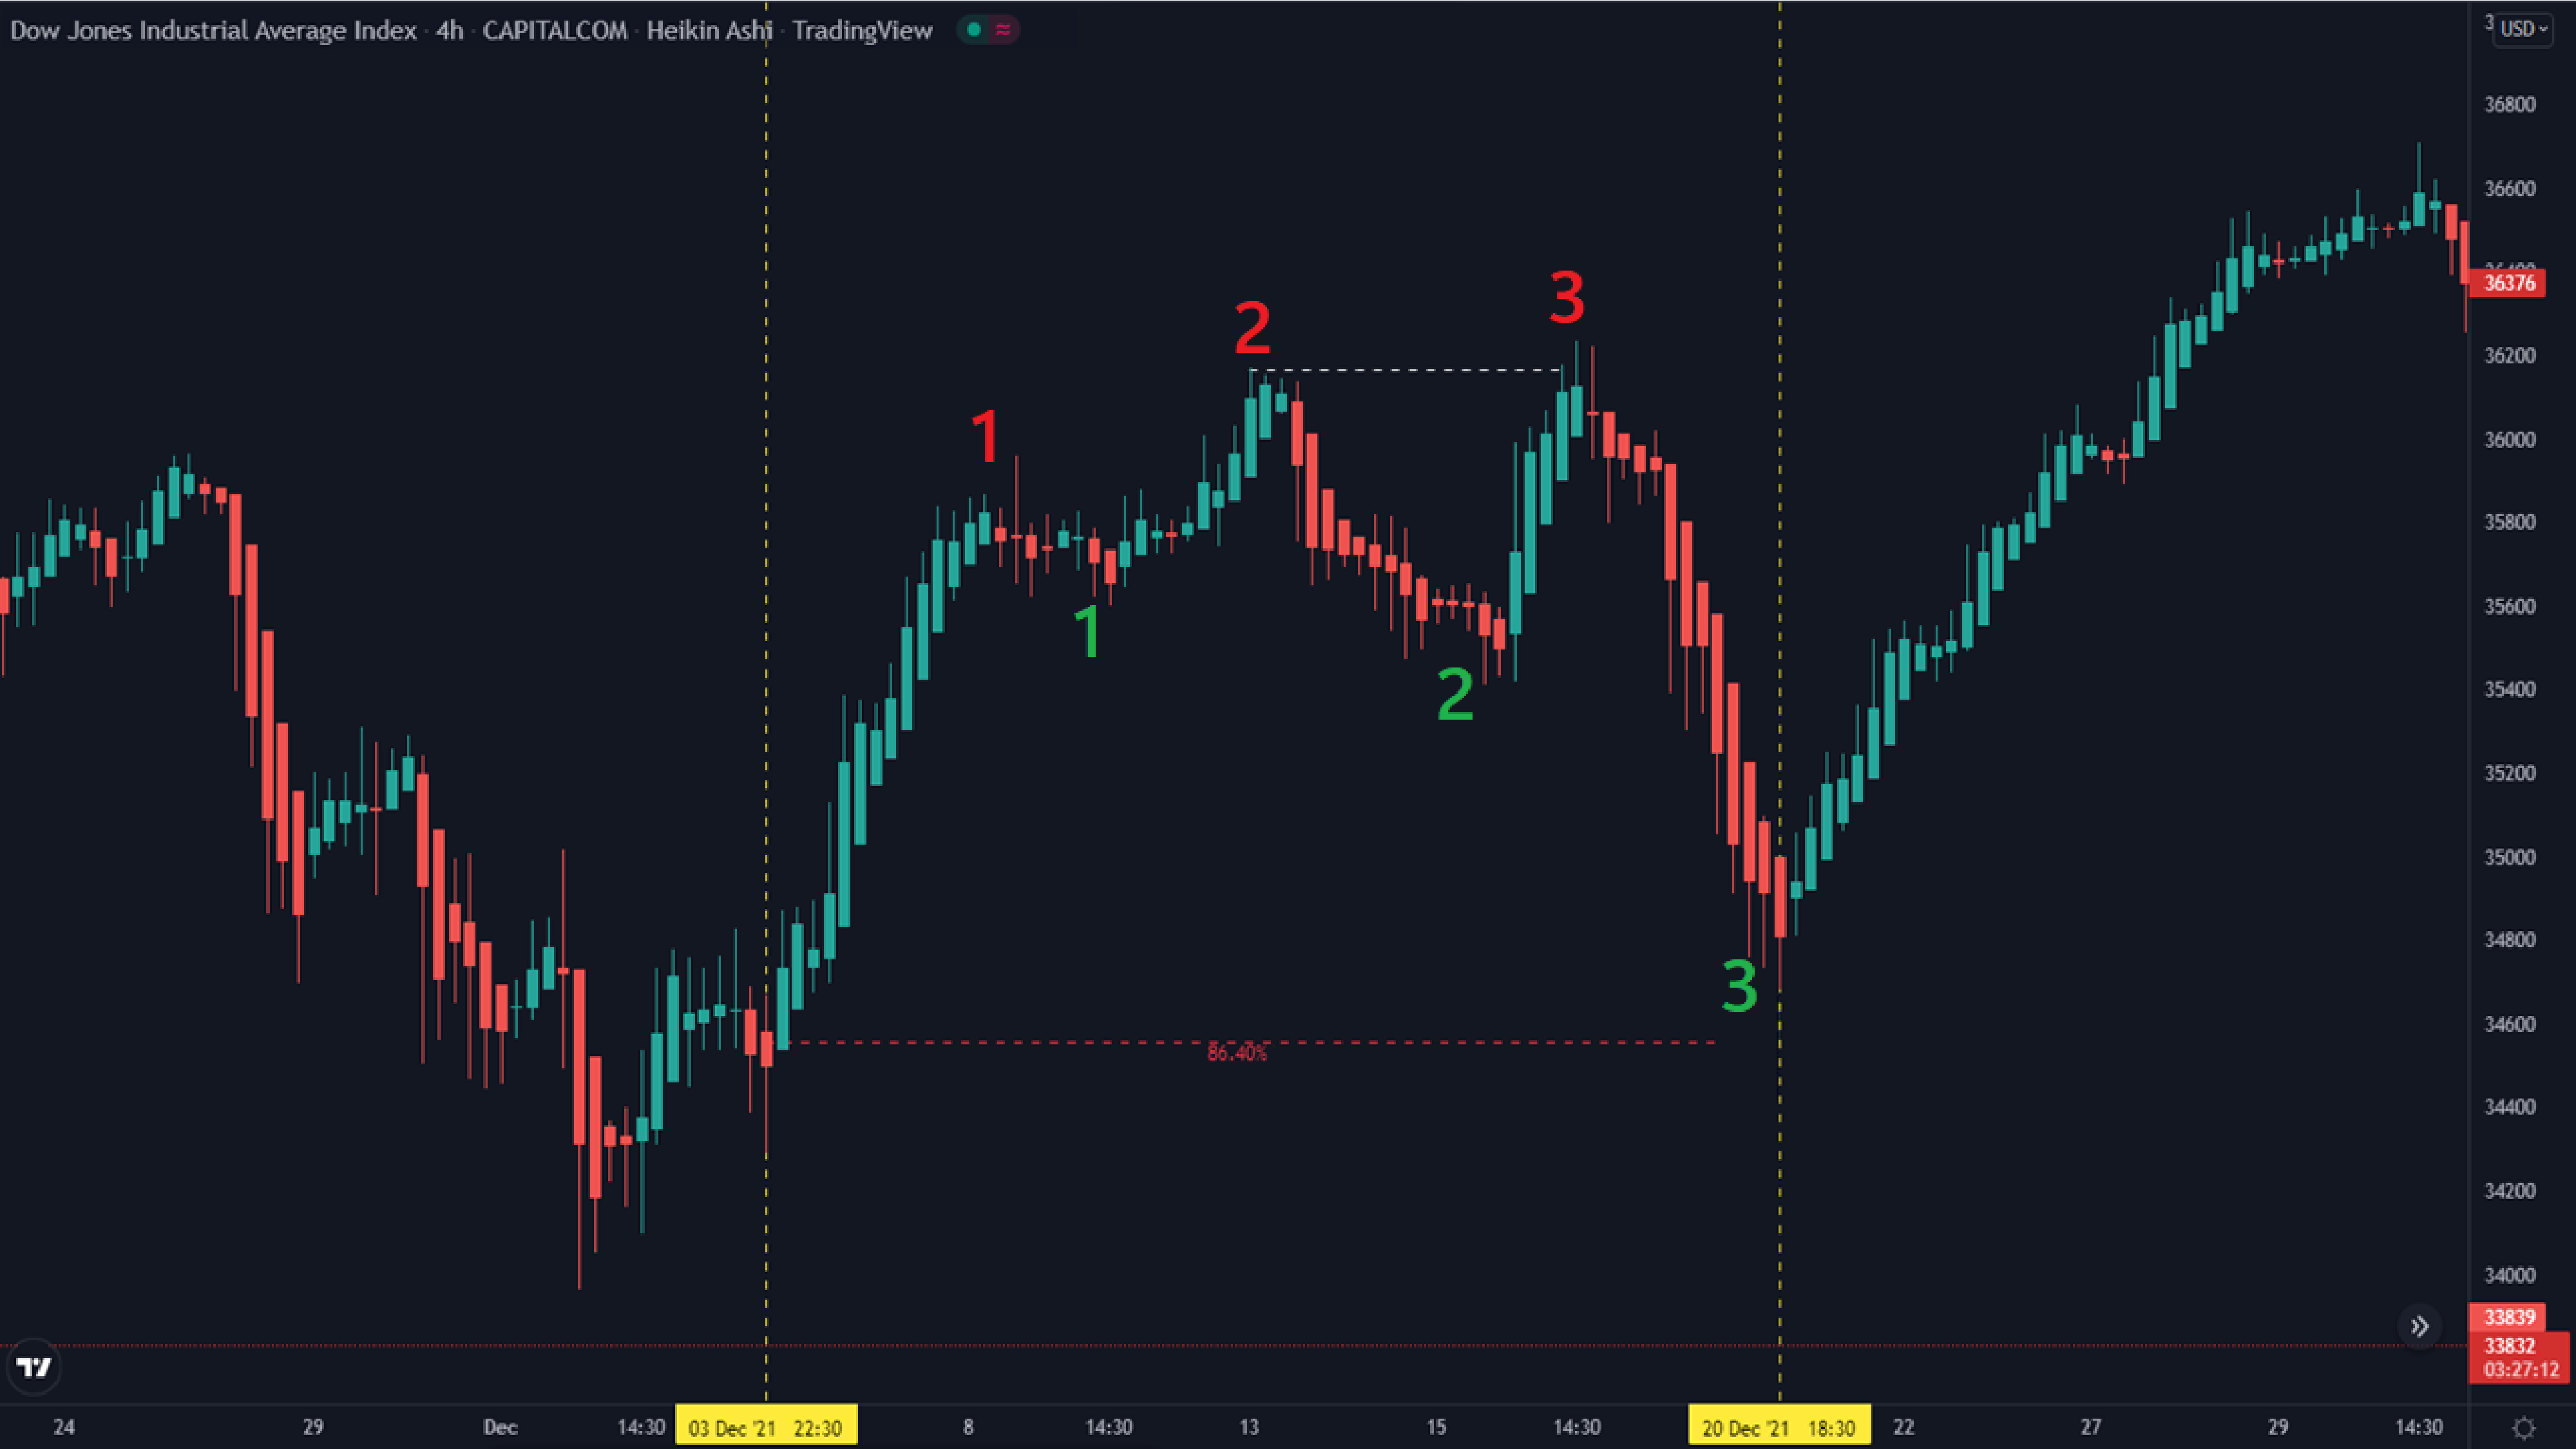
A positive hook at the end of a downtrend
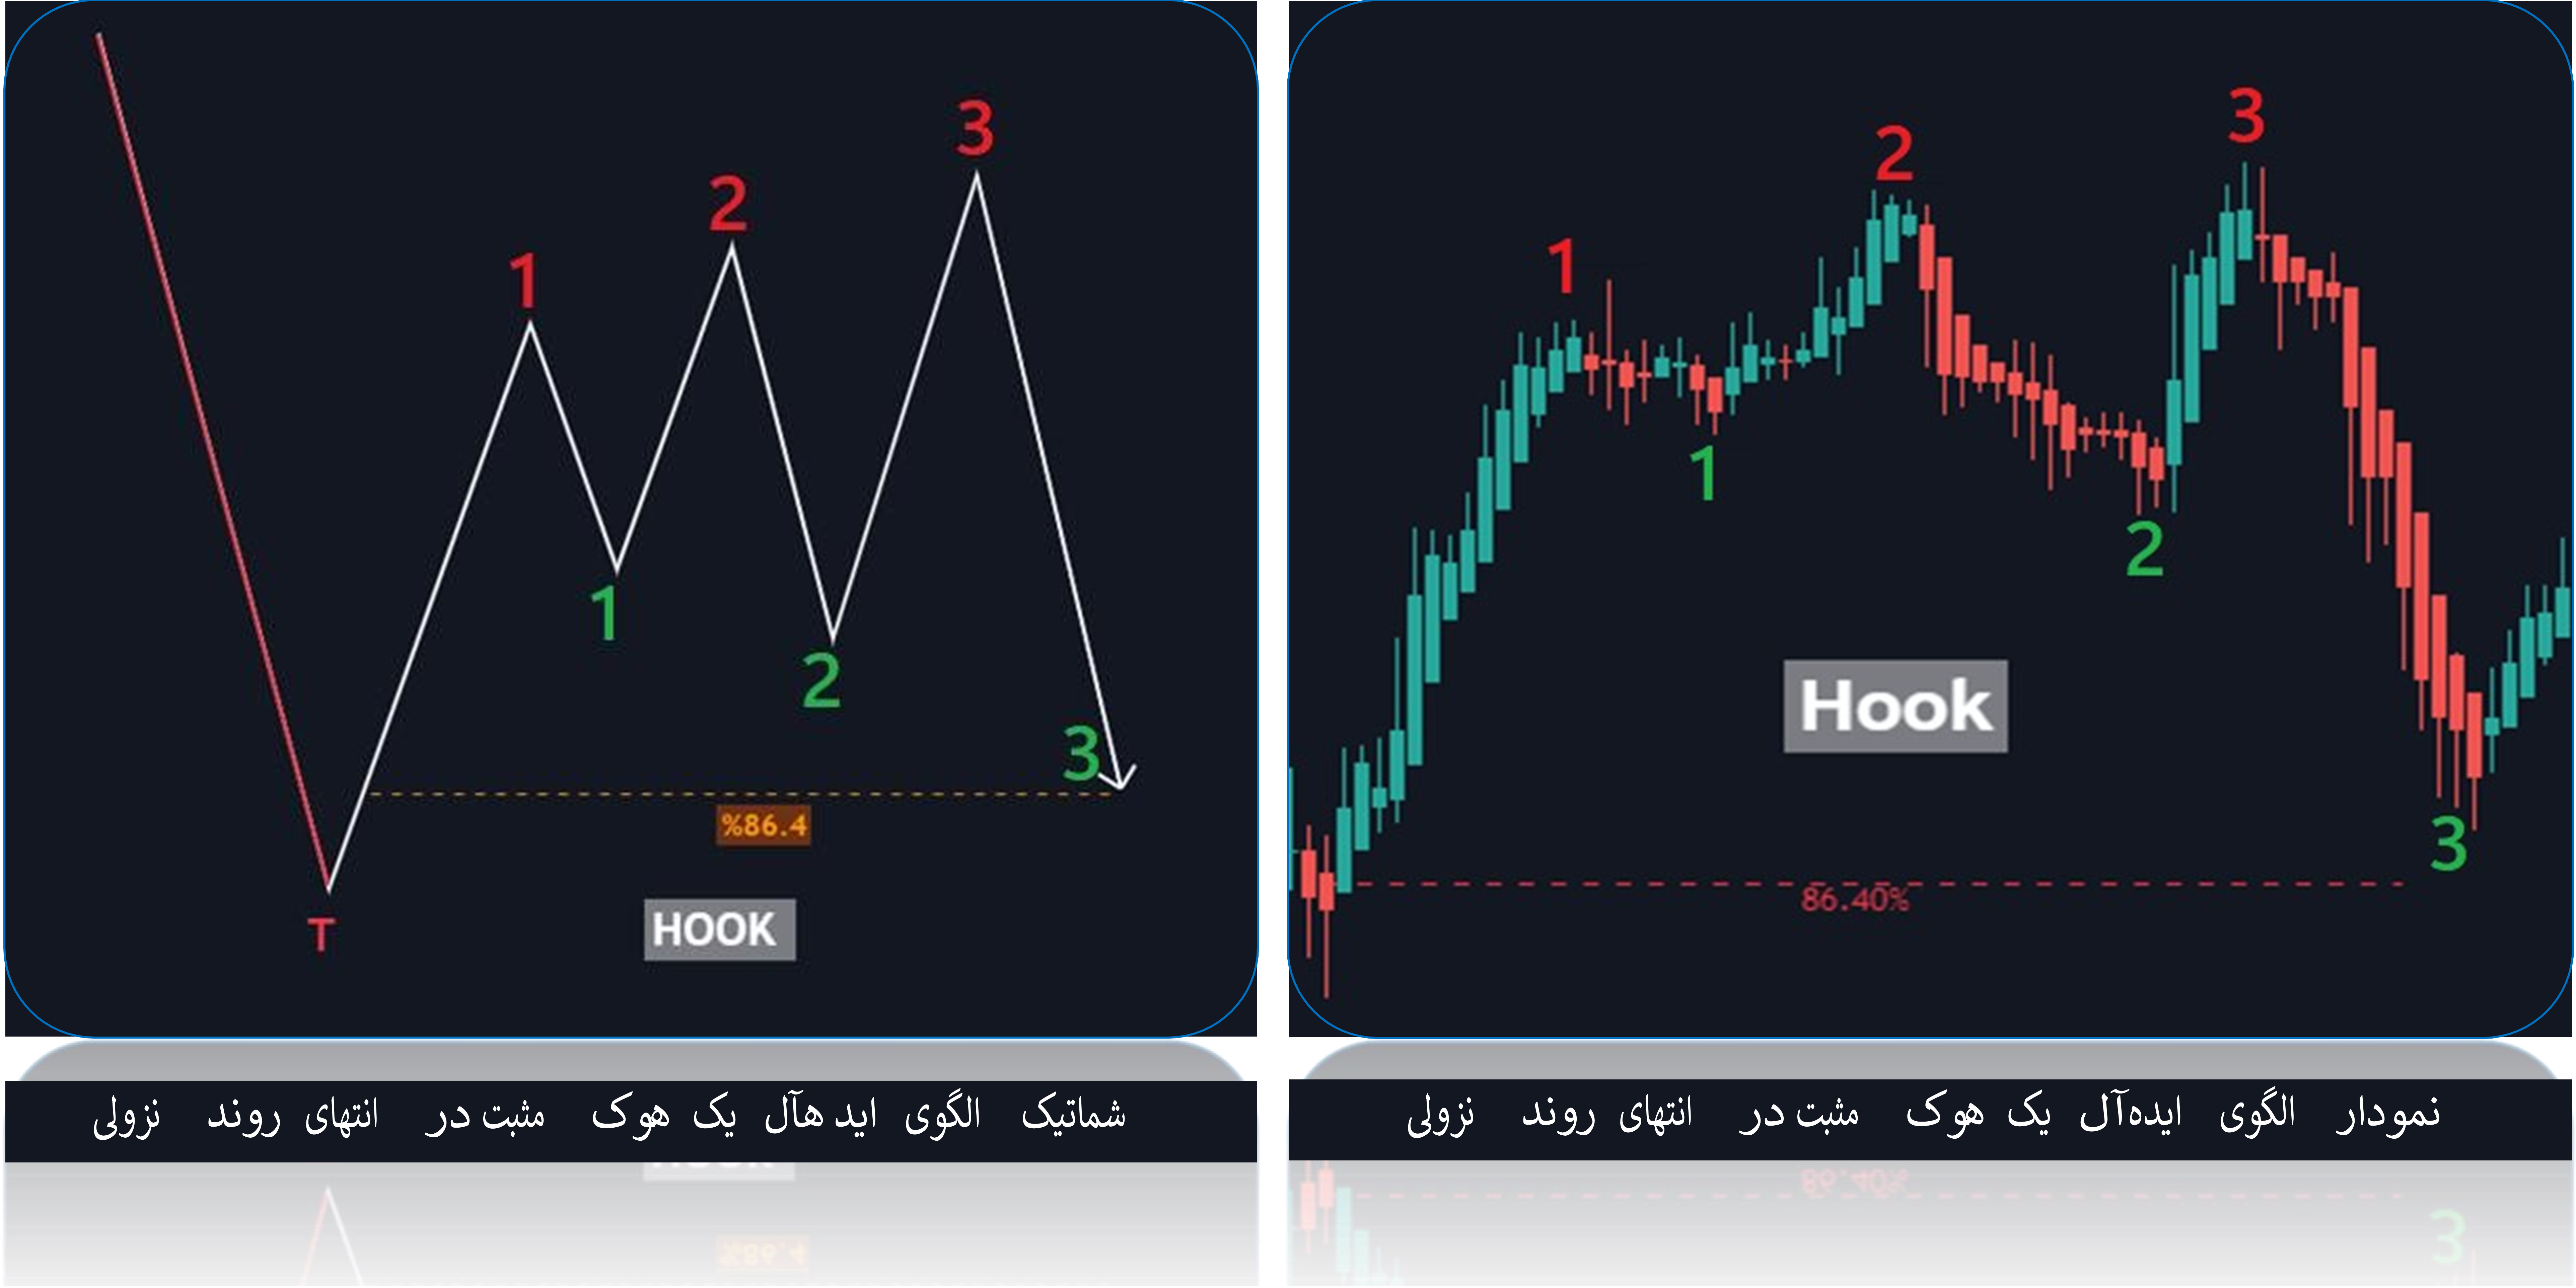
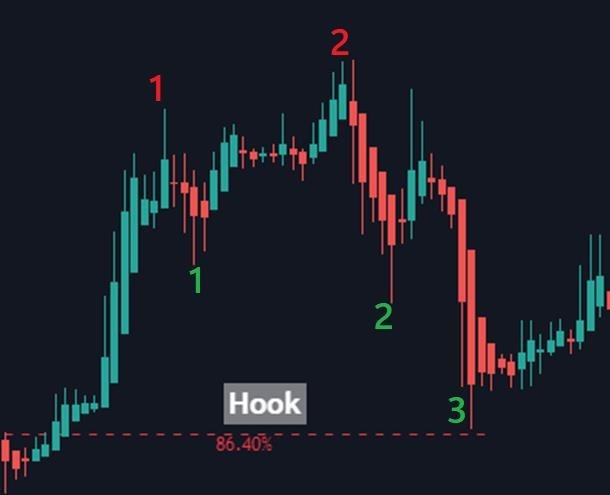
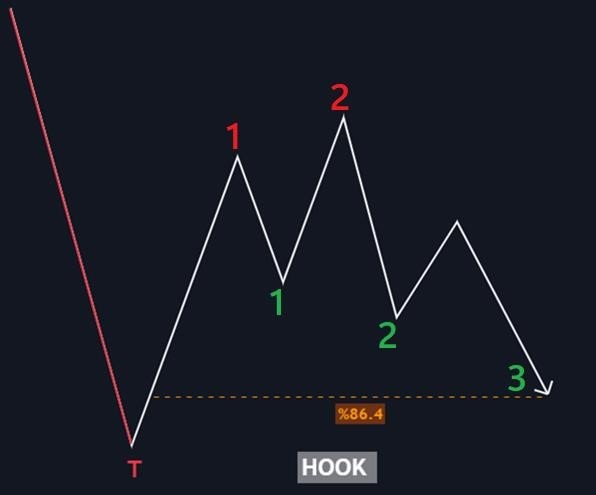
The figure below is a hook pattern, a hook that is supposed to catch small traders. In the ideal hook model, we have three peaks and three valleys, the condition of the peaks and valleys is that peak 3 is higher than peak 2, peak 2 is lower than peak 1, if such conditions exist, the best and You have caught the most ideal type of hook, and a hook is expected to start from point T and fall to point 3, which is 86.4% of the size of the movement from point T to point 3.
Definition of node or nodes:
Node: Nodes or nodes are the peaks and valleys that are numbered by the codes running in the banks and are formed one after the other according to the NDS strategy rules of these nodes. The conditions for selecting the nodes are such that any peak formed above the N1 peak is considered the N2 peak, and whenever a peak is formed above the N2 peak, we call it N3 and then the price falls. These nodes are the same in the valleys, so if a lower valley is formed under the S1 node, we call it S3 and the valley lower than S2 is S3. In the advanced topics of Algorithmic Trading, we do not name these nodes as N1, N2, N3, S1, S2, S3, in the following you will encounter the numbers 123 in peaks and valleys.
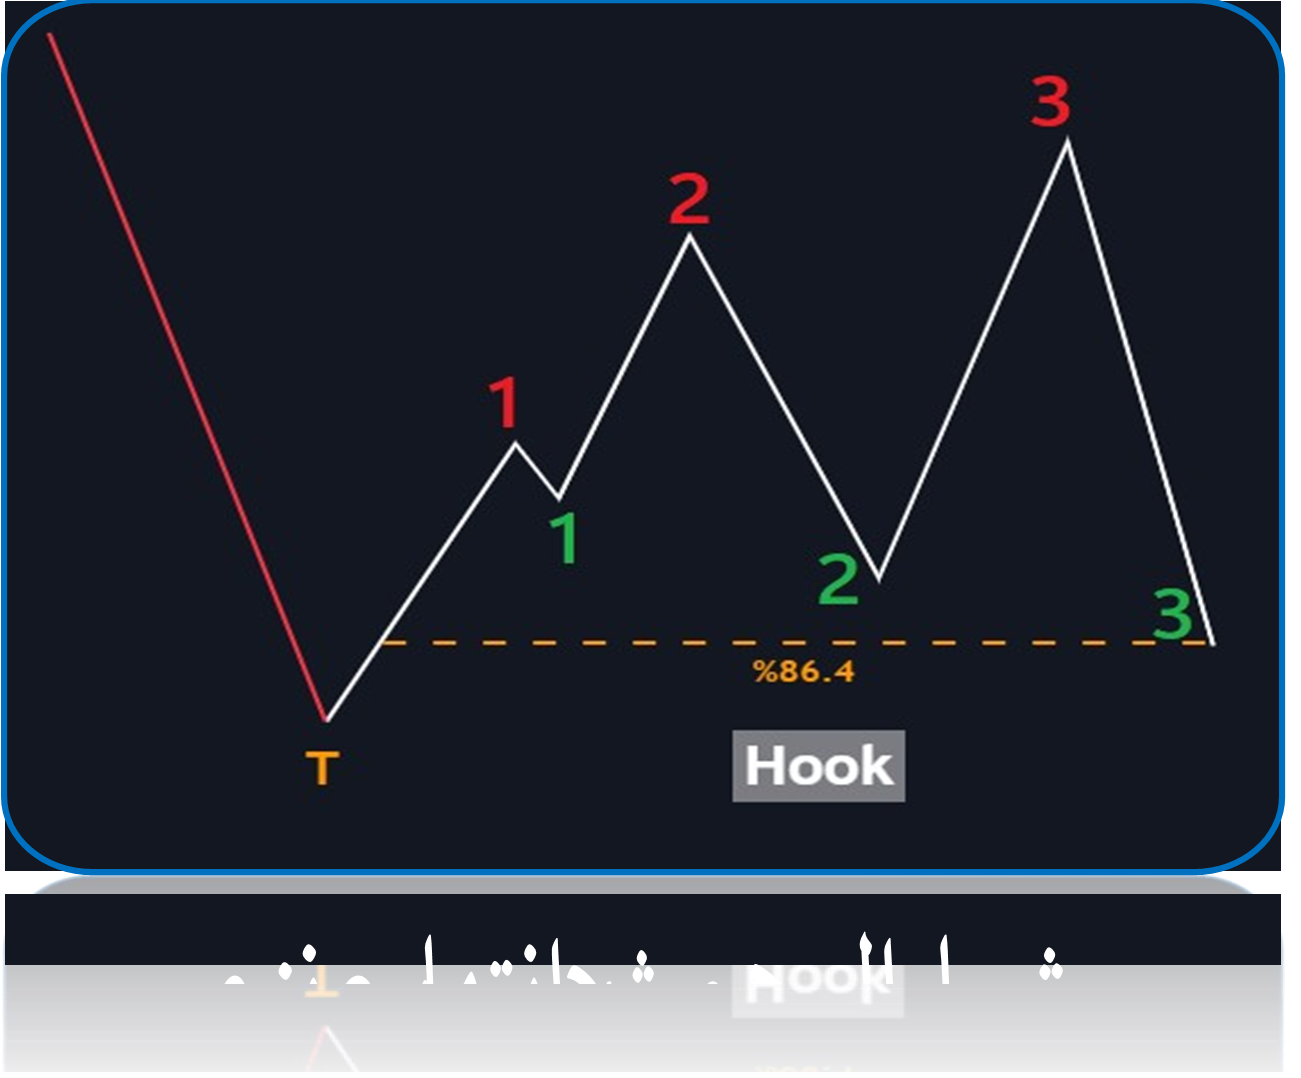
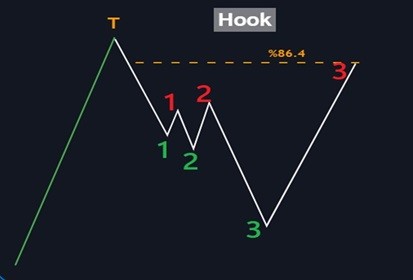
You saw some examples of ascending hooks in the figure. Now below is an example of a descending hook.
This descending hook pattern that is ready below, like the above patterns, must be closed at point 3. Valley 1, despite the fact that it was a small downward wave and a small correction, is still a valid valley and we expect the price to fall below Valley 1 and form Valley 2. Then the hook pattern in valley 3 will be completely closed on 4.86% of the movement length of point T to point 3. So you have learned that a hook pattern will always close at point 3. This hook pattern, like the previous patterns, must be closed at point 3. Peak 1, despite the fact that it was a small upward wave and a small correction, is still a valid peak and we expect the price to rise above Peak 1 and form Peak 2. Then, the hook pattern in peak 3 will be completely closed on 4.86% of the movement length of point T to point 3. A hook pattern will always close at point 3. In this pattern, you can see that in the falling phase from point T to point 3, the price leaves two peaks 1 and 2 open, and our expectation is that the price will go above peak 2 and at 4.86% of the previous falling log, the hook will be formed. Close completely.
Overview of a positive cycle:
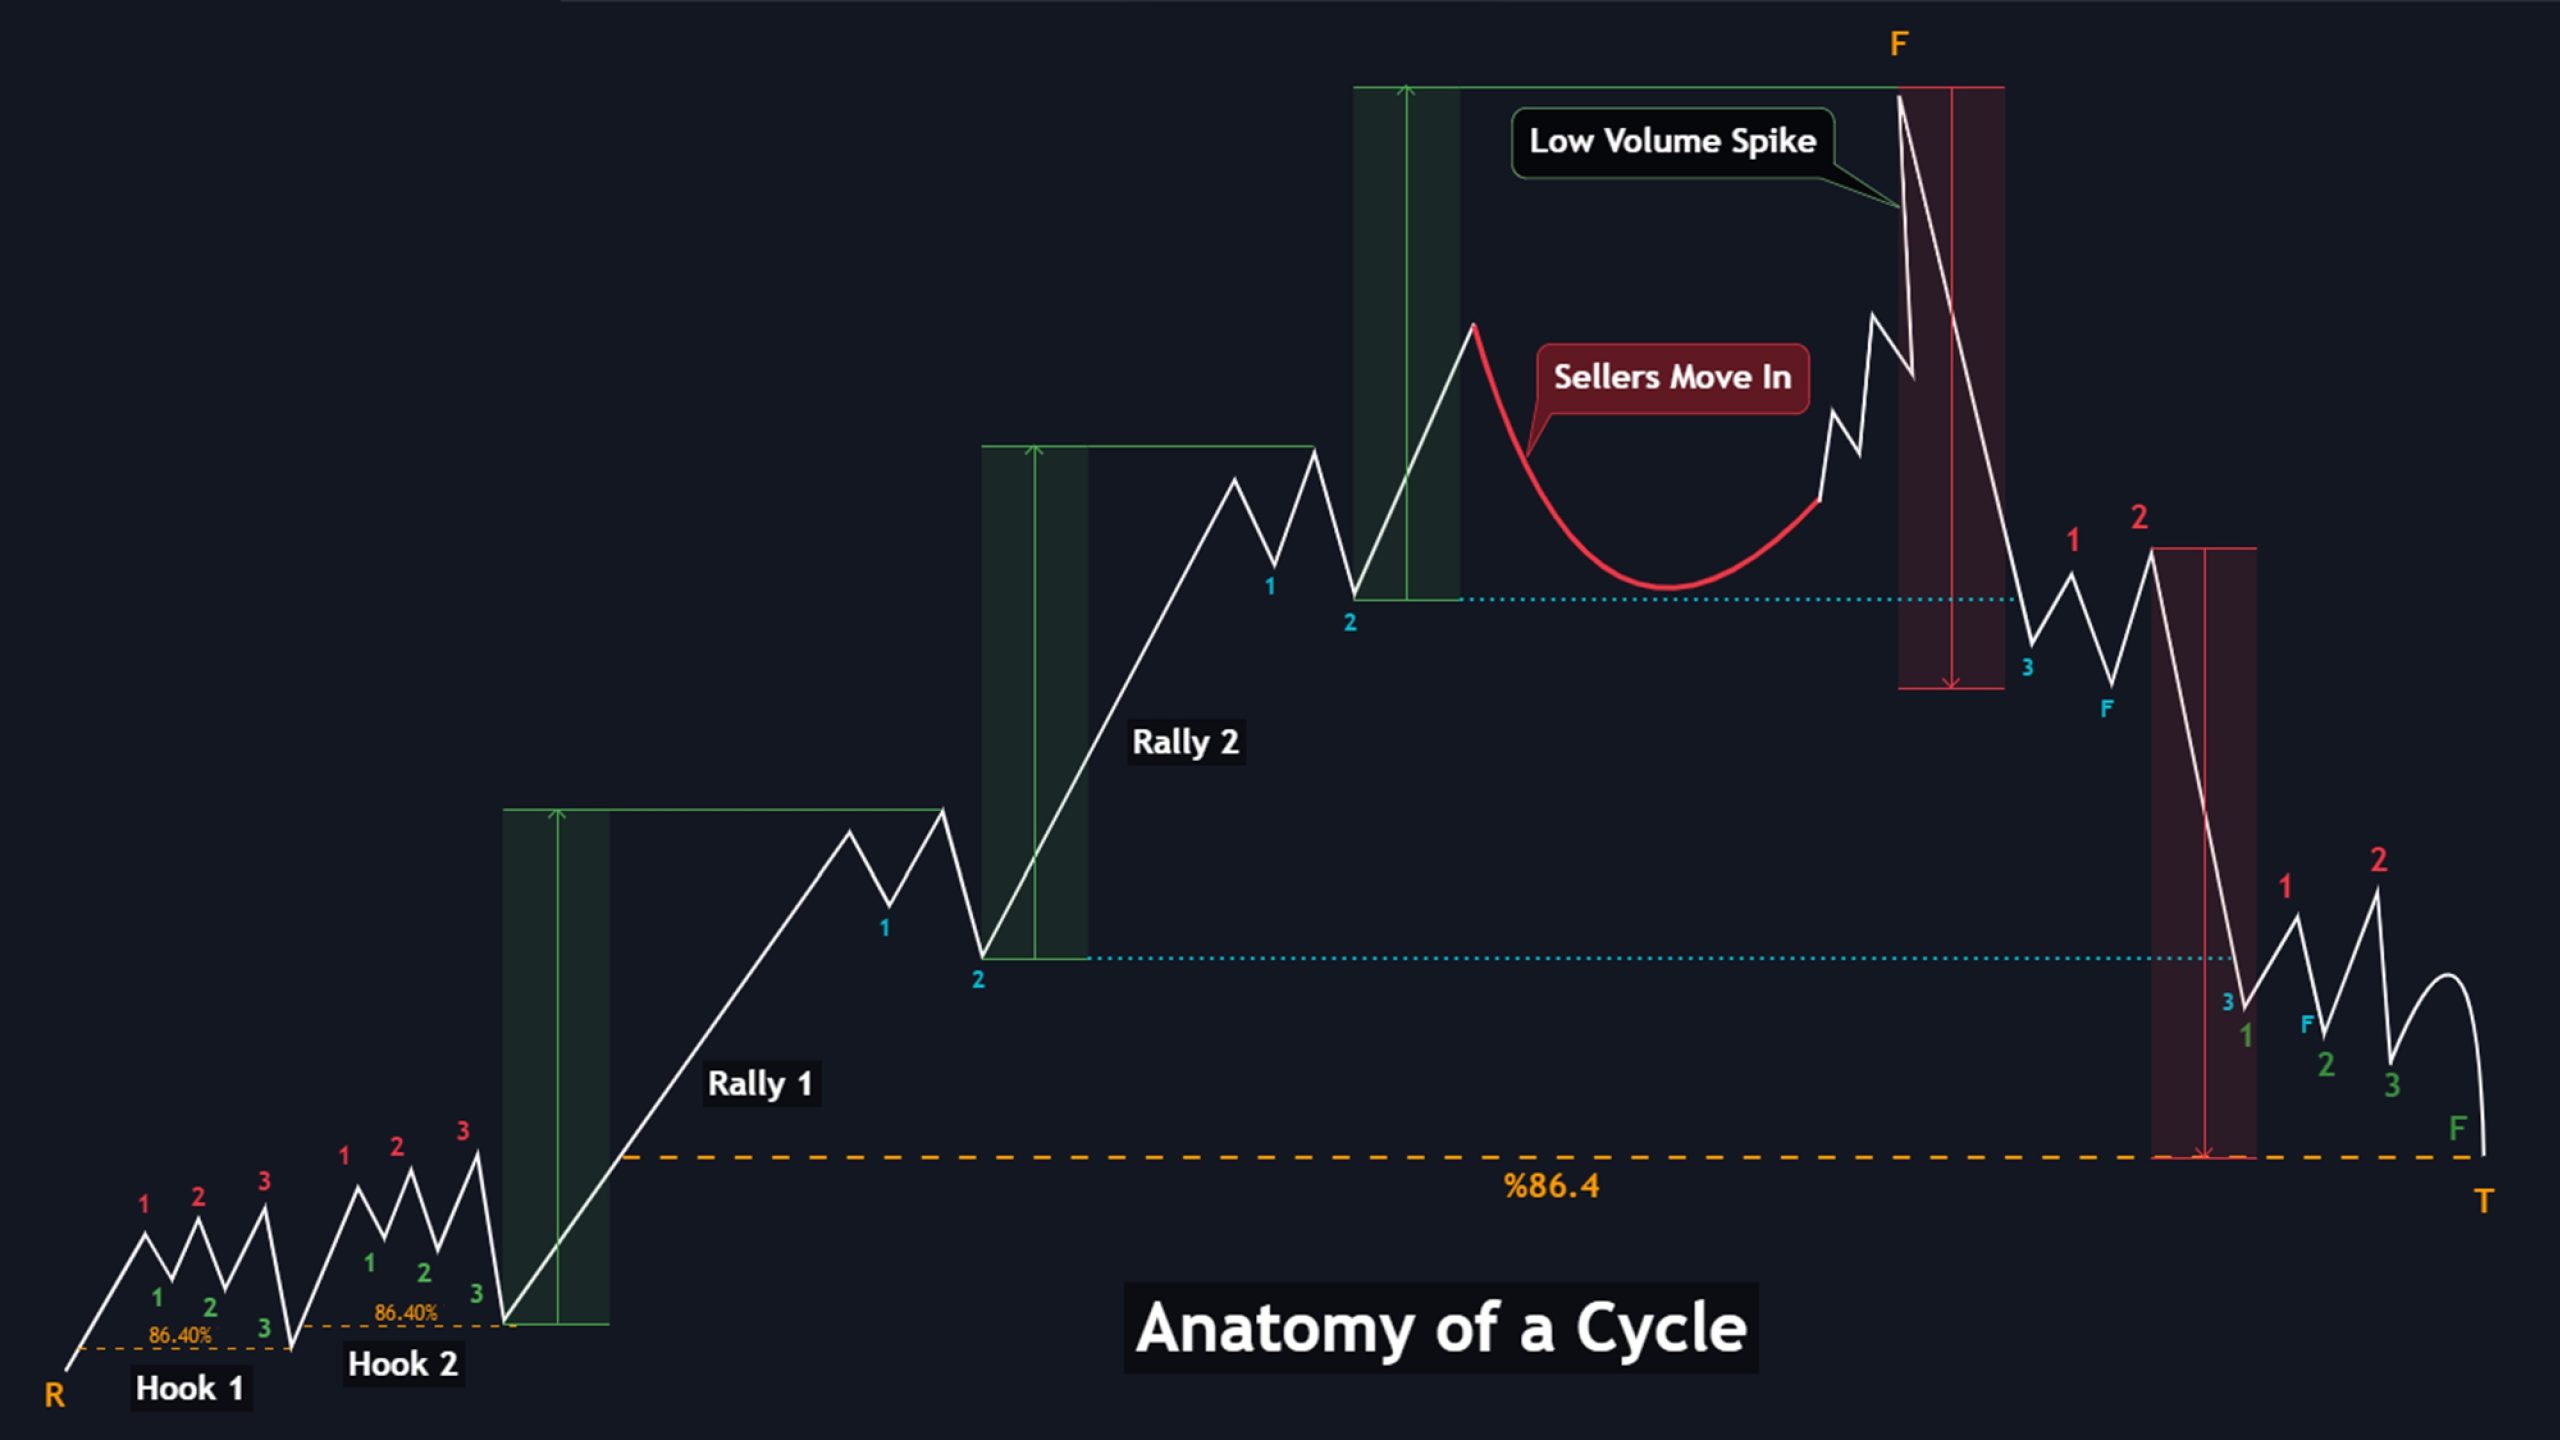
The above schematic shows the overview of a positive cycle which consists of two Hook patterns, two Rally patterns and a Flag pattern. Then after the Flag pattern, we will have a downward fall and the cycle will be closed at the T point. So, in general, it can be said that a cycle starts from point R and will make two hooks, two rallies and one flag until point F, and then it will fall to point T. As you can see in the cycle on the previous page, at the end of 2Rally we will have a drop (red chart) which is called Sellers Move In, which means that sellers will enter, and in order to get out of the game, the price will It goes up and activates a sharp upward movement, but with a very low volume (Low Volume Spike) and the loss limit of all traders who had shorted or sold. After damaging the seller group, then the amateur traders and newcomers think that the market has taken an upward trend and start long transactions or buying, and finally the market does not show mercy to this second group (buyers) and falls to the bottom. to close his cyclist. This was from the anatomy of the cycle.
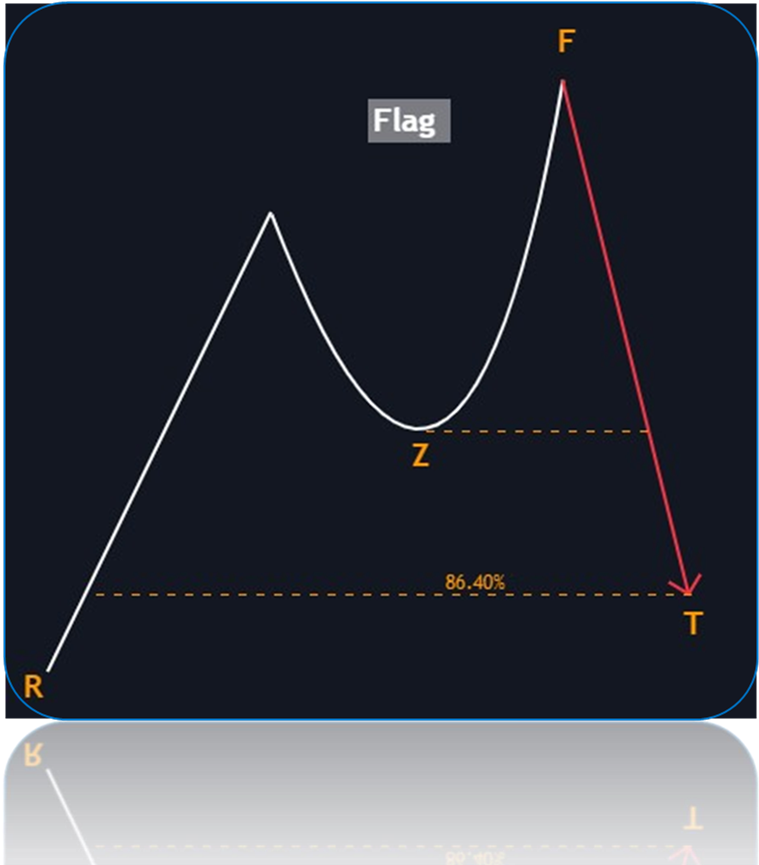
Positive Flag or Lip
The opposite pattern is called the Flag or Lip pattern, which shows us the end of a process. If the flag pattern is formed at the end of an uptrend, we will expect a fall from point F to point T. If the price could not fall to point T for any reason, it is possible to fall to point Z as the first target. In the flag pattern, first we expect the drop from point F to point Z in the lowest possible state, then the next drop point is point T and the cycle will be closed. So, in general, a flag, like the white chart, rises from an ascending wave, then a corrective wave to point Z and finally to point F, and the Flag pattern is made. In other words, first a rally is formed, then sellers enter, and finally, from point Z to point F, a low volume spike forms (Low Volume Spike), and the price at point F will be able to rise higher and start to fall to point T. and closes the cycle.
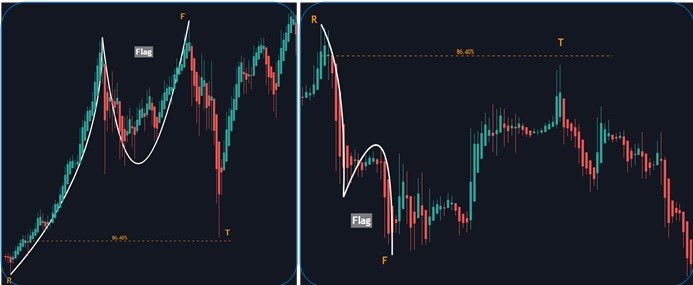
Now we see an example of flags in the figure:
Summary:
The steps of making a transaction in the NDS trading strategy are as follows:
- First, recognize the direction of the trend in the above time frame (M30-1Hour-4Hour).
- Check the time frames (M1-M5-M10) and look for the 123Flag setup and at the Flag point, make the first Short position with a suitable Position Sizing.
- Place the short trade loss limit above the flag and take the profit limit upward in each position correction.
- Remove the first margin at points 1 and 2. (preferably take out a third of your volume)
- Points 1 and 2 are closed with node 3, we will expect a local rally, so wait for the formation of the 123Flag setup.
- After forming the 123Flag setup on 86.4% of the first falling log, enter the second Short trade at the Flag point.
- Put the loss limit of the second Short transaction above the Flag and move the profit limit upward in each local correction.
- Measure the length of the falling log and according to the law of symmetry, we will expect the same amount of falling approximately.
- Place your profit limit at the end of the previous falling log symmetry and on open points 1 and 2.
- After node 3 closes points 1 and 2 and completes the symmetry, we will expect a bullish position, then exit a third of the trade volume.
- In the continuation of this downward trend, no matter how many setups you hunt, you make a new short trade, that is, you increase the volume of your transactions in the direction of the downward trend, whenever you reach points 1 and 2, the symmetry is also completed, a third of You remove the volume.
- This process continues until the final target is reached which is node 3 in the above time frame (M30-H1-H4), then exit completely.
Conclusion:
In this article, you got to know a summary of the Fuzzy Logic NDS strategy and you should keep in mind that in any style of trading, practice, increasing relevant knowledge and trading psychology will help the trader to achieve his goals in the financial markets. . This style is derived from mathematics and symmetry, which you should note in the financial markets, prices do not always pay attention to the same shape and behavior, and the trader should be flexible and patient in any trading style towards the behavior of the market in order to find suitable patterns for Find your trading style.