Ichimoku cloud indicator tutorial
We can safely say that the Ichimoku indicator is one of the most popular indicators in the world of technical analysis. This indicator is also called “Ichimoku cloud chart”. From the appearance of the name Ichimoku, one can guess its Japanese roots; Because this name means “at a glance” in Japanese. The attractive point of Ichimoku is that with one glance you can get a good understanding of market trends, strength and willingness of buyers and sellers. However, it does not matter whether you are new to the financial markets or have experience in this field; In any case, Ichimoku learning is highly recommended as the most widely used technical analysis tool along with other indicators. Join us to learn about the king of indicators, Ichimoku Kinko Hyo.
Table of Contents
- What is the Ichimoku indicator?
- History of the Ichimoku cloud indicator
- What are the important components of an Ichimoku cloud chart?
- Como Cloud in Ichimoku
- Ichimoku settings on the MetaTrader 5 platform
- Ichimoku indicator trading strategies
- Disadvantages of Ichimoku at a glance
What is the Ichimoku indicator?
Simply put, Ichimoku Cloud Chart is a complex but powerful technical analysis indicator that helps traders identify trends, support and resistance levels, as well as buy and sell signals. To use this indicator, you must know how to work with candlestick charts. One of the main uses of Ichimoku is to identify support and resistance lines. In addition, Ichimoku is used to measure the momentum of the price trend as well as to detect market behavior. If you are looking to predict and analyze the future trend of the market, the Ichimoku indicator is one of the best tools for you. This indicator can act as a forecasting tool in the market by determining the support and resistance lines and identifying the entry and exit points of transactions.
Initially, Ichimoku was mostly used in commodity and futures markets, but later Forex traders have also realized its usefulness. This indicator is most useful for traders who keep their positions open for a few days. Therefore, this system works better for longer time frames than small time frames like 30 minutes or 5 minutes.
As you can see in the image below, the Ichimoku indicator has a completely unique graphical environment. Maybe if you are a beginner trader, it may be difficult for you to work with this indicator at first; But there is no need to worry. You can easily use it by mastering the lines and various components of this indicator and get a significant profit from it.
History of the Ichimoku cloud indicator
It may be interesting to know that Ichimoku was first developed by a Japanese journalist named Goichi Hosoda. Goichi was one of the professional traders. He spent more than 30 years of his life studying and developing Ichimoku. After this effort, he was finally able to present this indicator to the trading community for the first time in the 1960s.
Why was the Ichimoku indicator introduced?
Hosoda believed that this indicator could help traders understand the balance between supply and demand forces and make more informed trading decisions based on that. The first people who used Ichimoku were Japanese traders, but gradually Ichimoku gained many followers among other traders in the world.
What are the important components of an Ichimoku cloud chart?
If you add the Ichimoku indicator to your desired price chart, the first thing that happens is that 5 lines of different colors are added to the chart. These 5 lines are the main components of the Ichimoku cloud chart:
- Tenkan-sen
- Kijun-sen
- Senkou span A
- Senkou span B
- Chikou span
In the following, you will get to know each of these lines.
Tenkan-sen line in Ichimoku
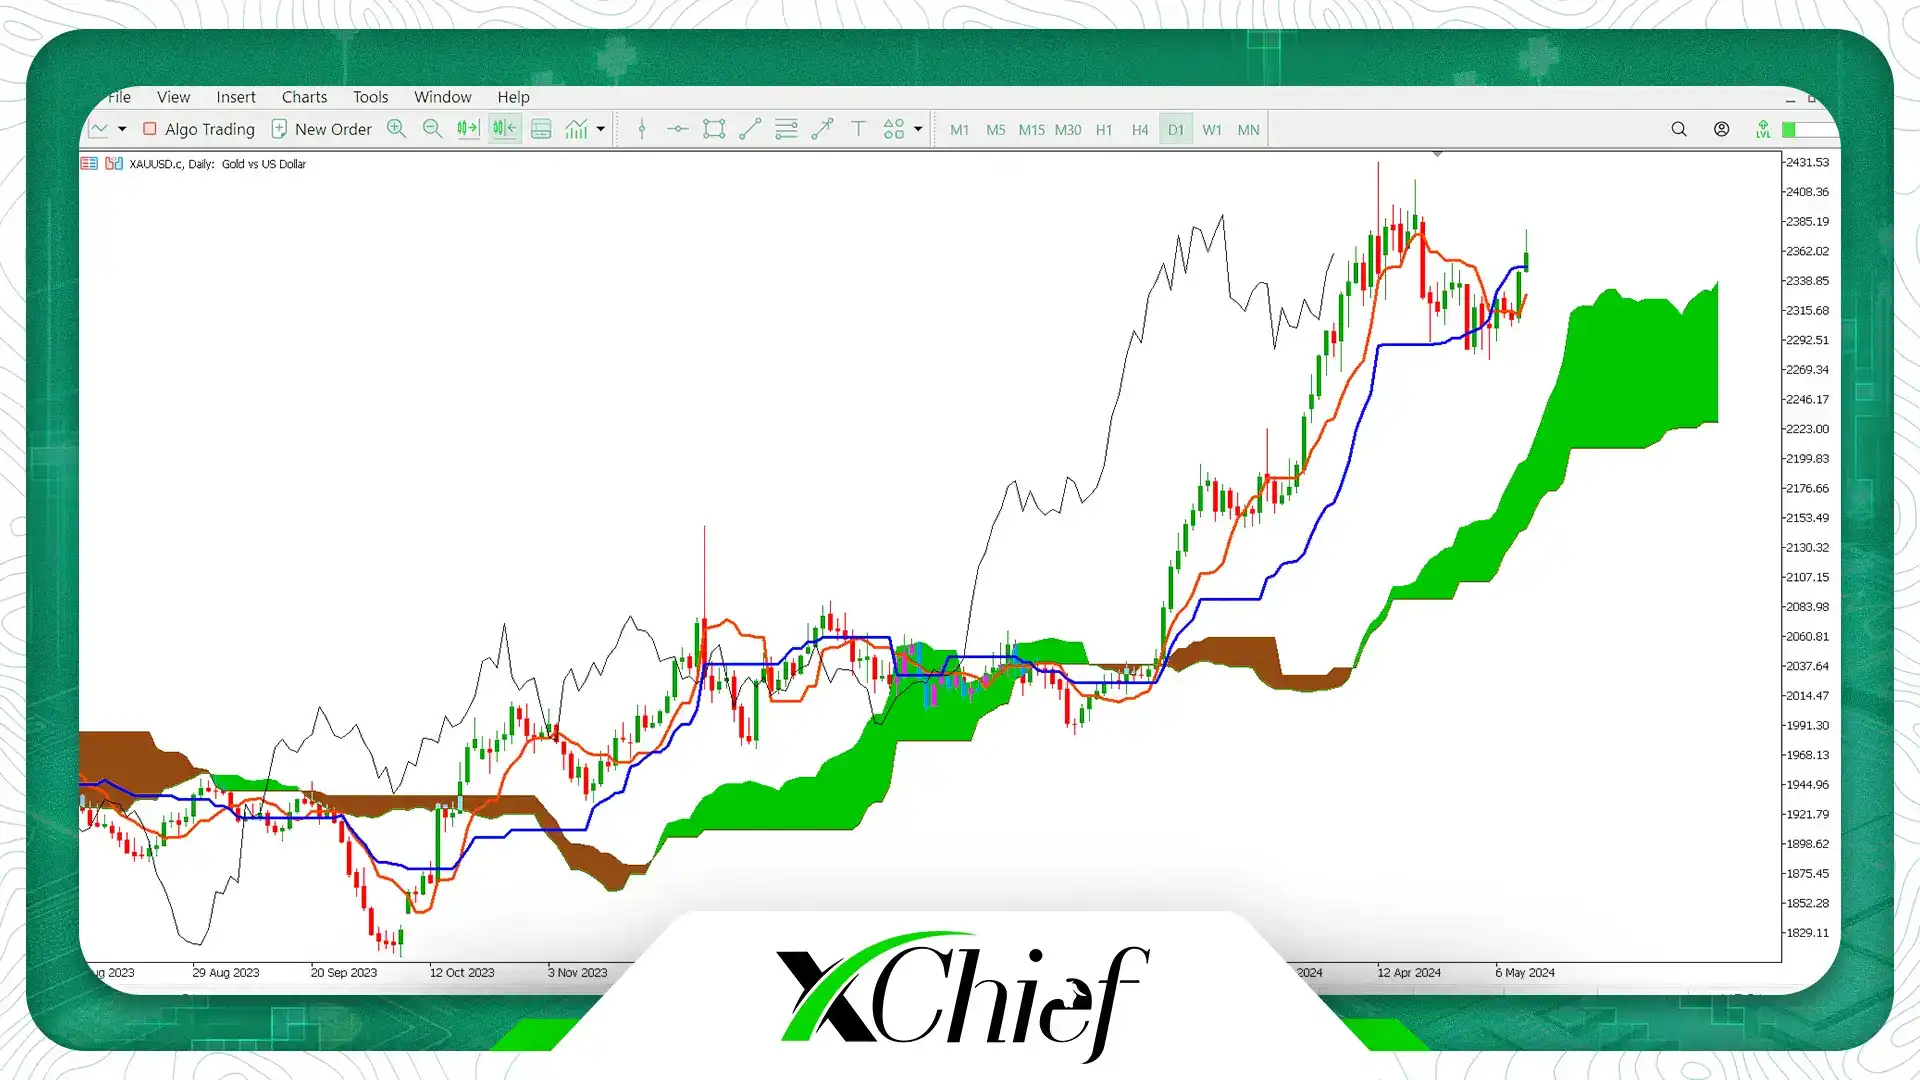
The Tenkan-sen line is one of the main lines of the Ichimoku indicator, which is also called the Conversion Line or the Return Line. Tenkan-sen are obtained from the average points of the highest price and the lowest price in the last 9 periods. For example, if your trading timeframe is 4 hours, the Tenkan-sen value is the average of the lowest price and the highest price in the last 9 candlesticks of 4 hours. With each new candlestick, Tenkan-sen is recalculated and the new point is recorded on the price chart. This process continues and by connecting these points to each other, Tenkan-sen’s line is created.
An important point to note is that the Tenkansen is completely different from the exponential moving average or simple moving average with period 9. Because Tenkansen only deals with the highest and lowest prices in the last 9 periods, but a moving average with 9 periods includes all 9 candles in its calculations and has nothing to do with the highest and lowest prices. If you use Ichimoku to analyze market trends; It is good to know that in upward trends, Tenkan-sen’s line will act as a support level; On the contrary, in downward trends, you can use this line as a resistance line. In the image below, you can see the Tenkan-sen line by itself on the daily chart of gold (XAUUSD):
Kijun Sen
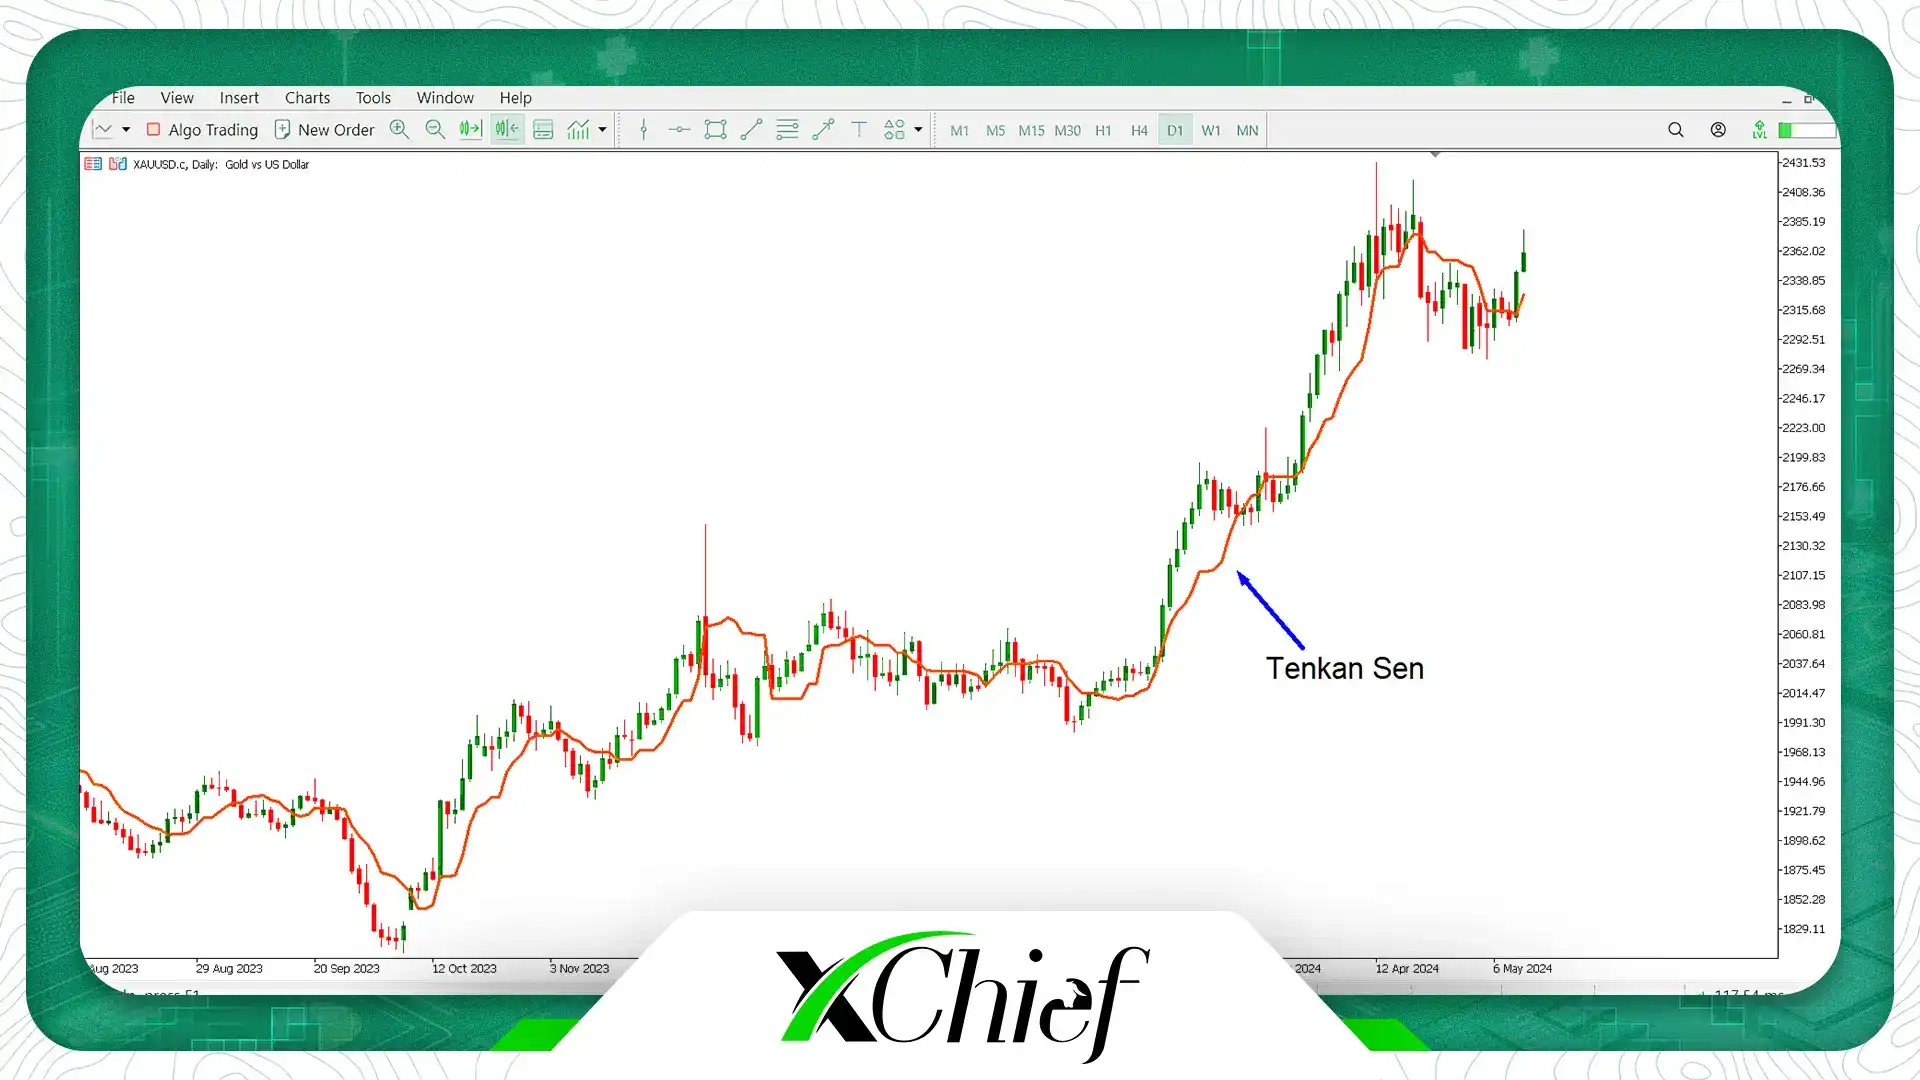
Kijun-sen is one of the main lines of the Ichimoku indicator, which is also called Base Line. Kijun-sen is obtained from the average points of the highest price and the lowest price in the last 26 periods. For example, if your trading timeframe is 4 hours, the Kijun-sen value is the average of the lowest price and the highest price in the last 26 candles of 4 hours. With each new candlestick, the Kijun-sen is recalculated and the new point is recorded on the price chart. This process continues and by connecting these points to each other, the Kijun-sen line is created.
An important point to note is that the Kijun-sen is completely different from the exponential moving average or simple moving average with a period of 26. Because Kijun-sen only deals with the highest and lowest prices in the past 26 periods, but a moving average with 26 periods includes all 26 candles in its calculations and has nothing to do with the highest and lowest prices. It should be noted that in upward trends, the Kijun-sen line will act as a support level; On the contrary, in downward trends, you can use this line as a resistance line. In the image below, you can see the Kijun-sen line by itself on the daily chart of gold (XAUUSD):
Senkou span A
Senkou span A is one of the most important lines and indicators in Ichimoku that will help you analyze the future trend of the market. This line is usually displayed in dark green. Senkou span A is actually obtained by averaging the Tenkan-sen and Kijun-sen values, which have been moved forward 26 periods. Senko Span A is one of the strongest support and resistance levels in the Ichimoku indicator.
Senkou span B
Senko Span B is one of the important Ichimoku lines, which is obtained by taking the average between the highest and lowest prices of the previous 52 periods and then carried forward 26 periods into the future. This line is one of the interesting tools for predicting 26 future periods in the price trend. The calculation formula of Senko B is also the same as Tenkan-sen; with the difference that instead of 9 periods, you have to calculate the values of the lowest and highest prices for the previous 52 periods.
From the Senko Span B, you can easily identify whether the price trend is bullish or bearish, for example, if this slope of the line was moving up, the price trend is bullish, and if it was moving down, it would be a bearish trend. Just like Senkou Span A, you can use this line as support and resistance levels in the market.
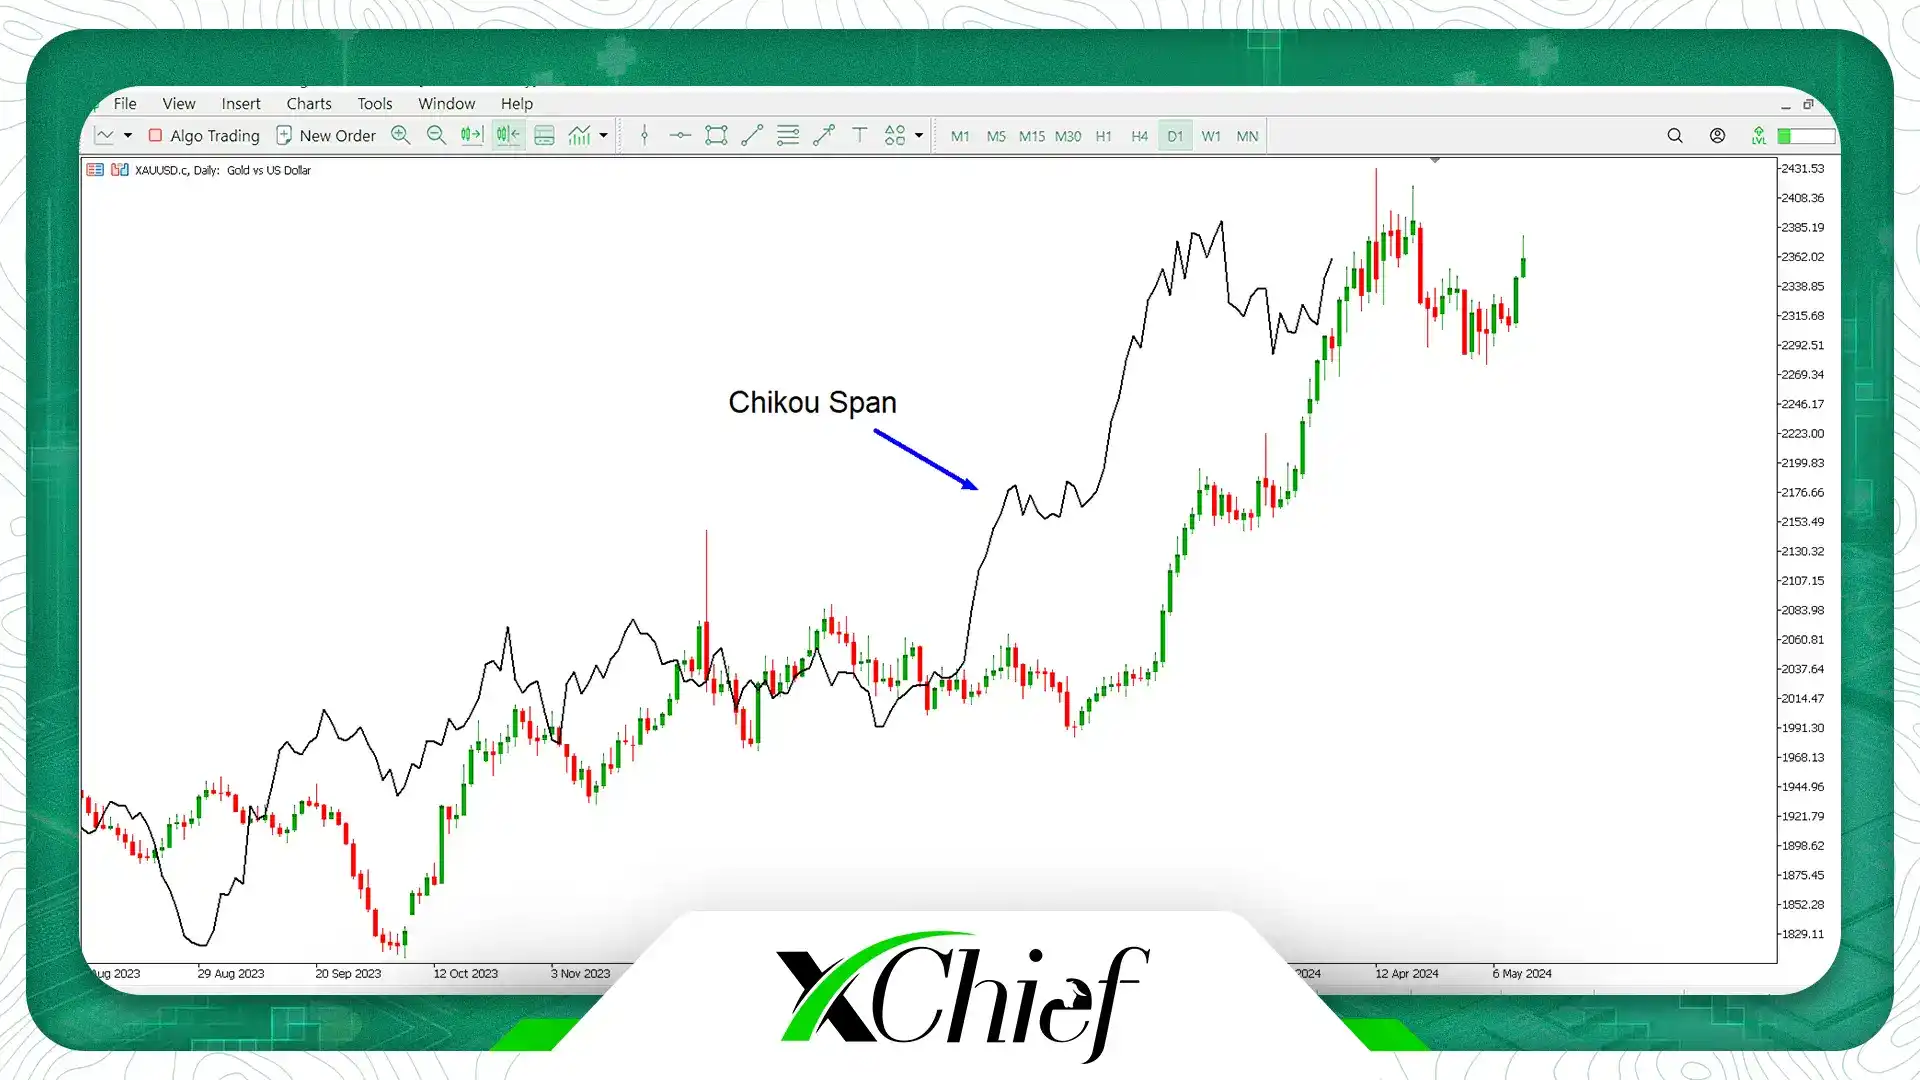
Chikou Span
Chikou span is one of the most interesting Ichimoku lines, also called “Lagging Span”. Chikou Span is the same price chart that has become a line and has been transferred to the past by 26 periods. With the help of Chico Span, you can compare the current price of the desired asset with its price in the last 26 days. On the other hand, this line helps you to recognize the market trend and determine its strength. In the image below, you can see Chikou span on the daily chart of gold (XAUUSD):
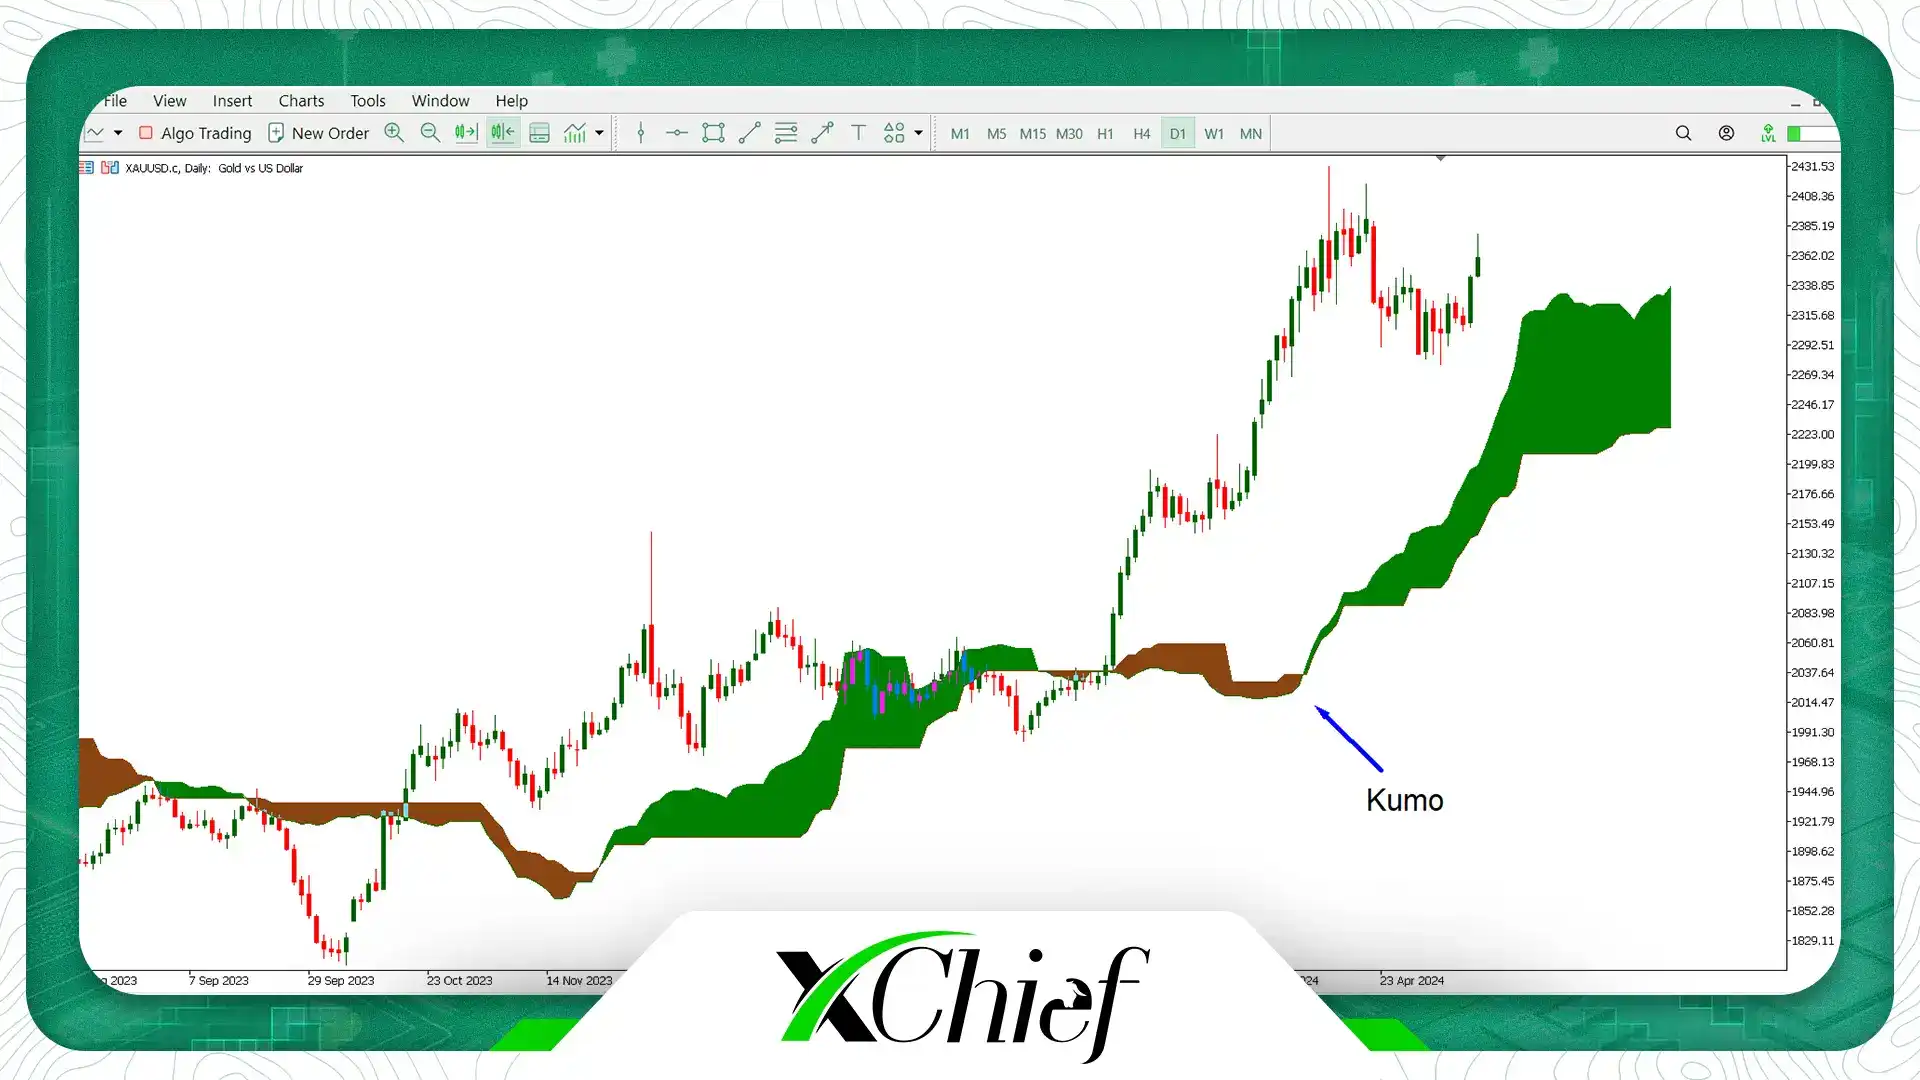
Como Cloud in Ichimoku
The Kumo cloud, which is the most important part of the Ichimoku indicator, forms the area between the two lines known as Senko Span A and Senko Span B. In fact, if Senko Span A is higher than Senko Span B, the cloud will be bullish and indicates the market’s upward tendencies, and if Senko Span A is lower than Senko Span B, the cloud will be bearish and indicates the market’s downward tendencies. In trading platforms, they usually show the bullish cloud in green and the bearish cloud in red . The general view regarding Ichimoku is that if the price is above the cloud, the overall trend will be up and if the price is below the cloud, the overall trend will be down.
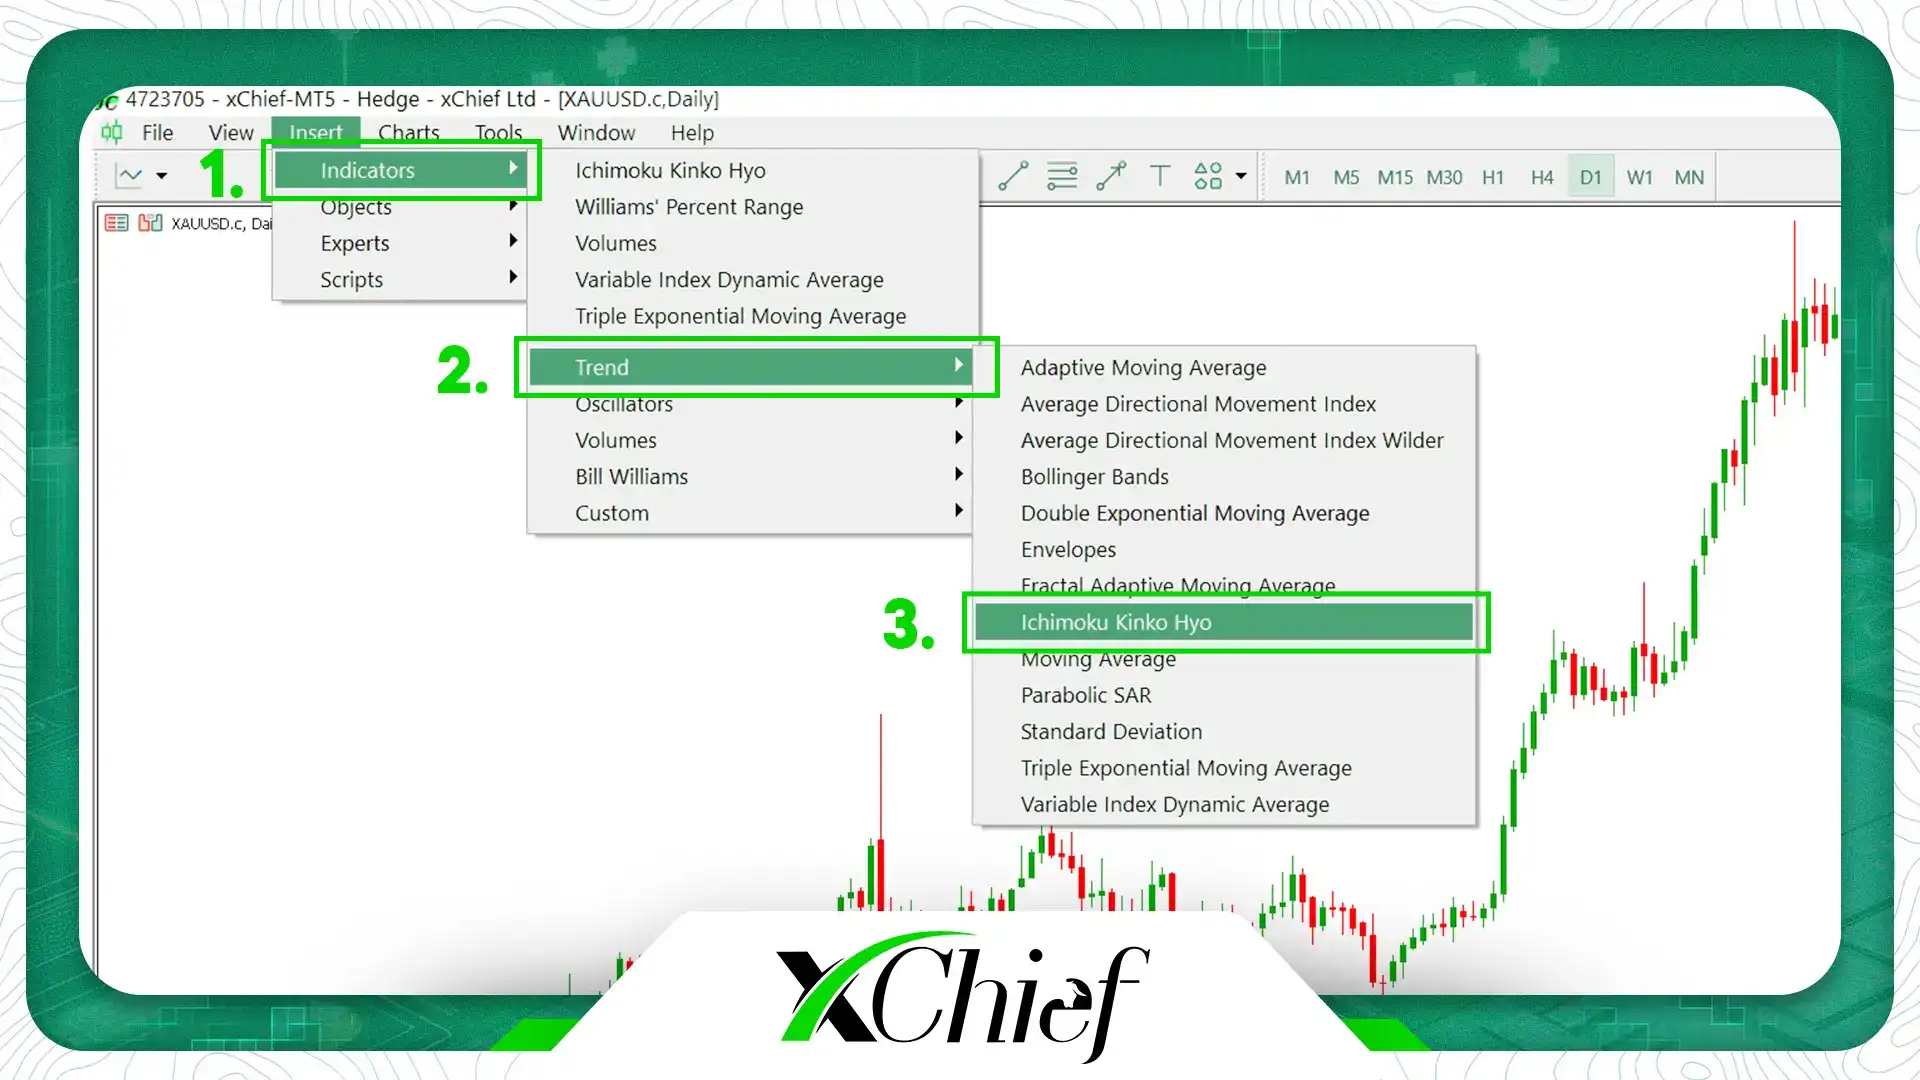
Ichimoku settings on the MetaTrader 5 platform
Since the indicator may seem a little complicated and busy to you at first, we are going to teach the special settings of Ichimoku in the Metatrader 5 platform of Broker X Chief. To do this, first download and install the platform suitable for your trading system from the Platforms section of the Broker X Chief website at www.xchief.com/fa . xChief broker has provided a variety of trading platforms for a wide range of its users, and you can use xChief trading platforms on any operating system you want. After installing the Metatrader platform, first do the basic settings and prepare the price chart. Now, to add the Ichimoku indicator to the desired chart, enter the Indicators section from the Insert tab and click on the Ichimoku Kinko Hyo indicator from the Trend section. You can see the mentioned steps in the image below:
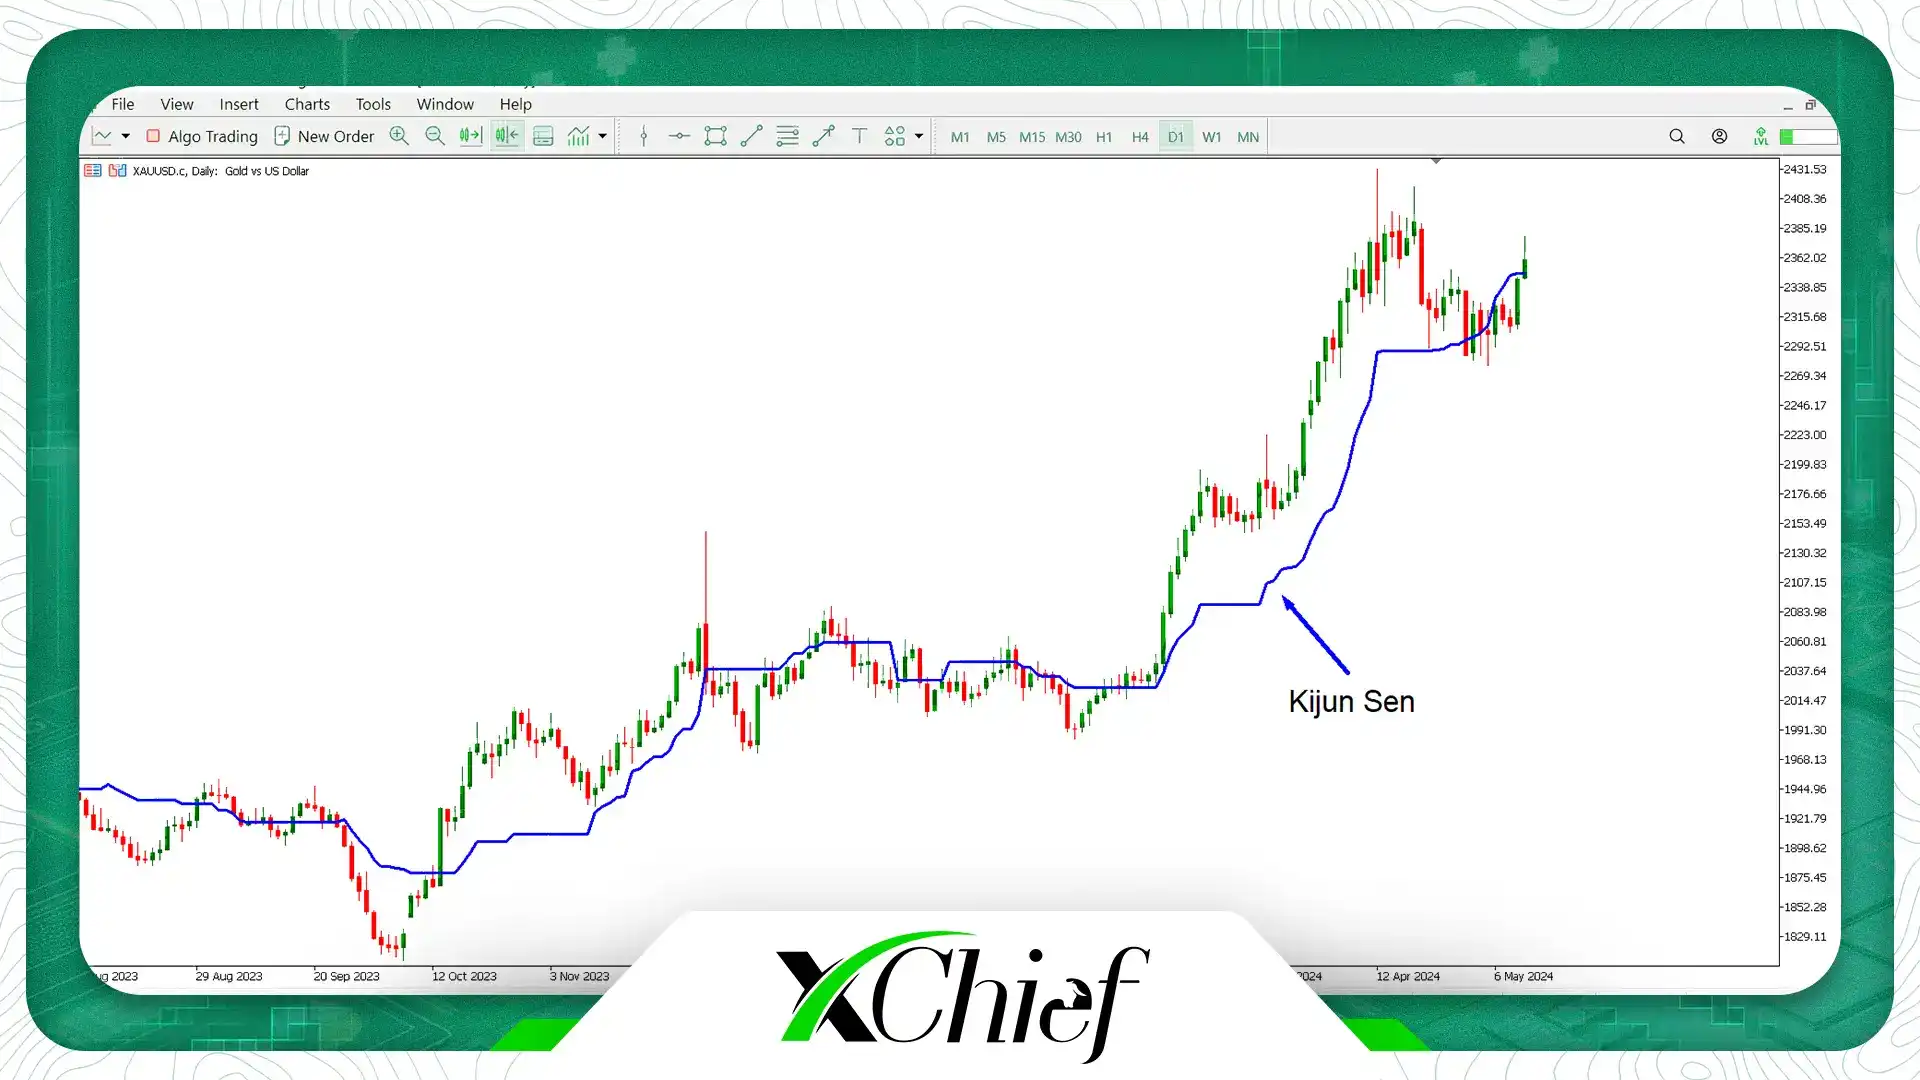
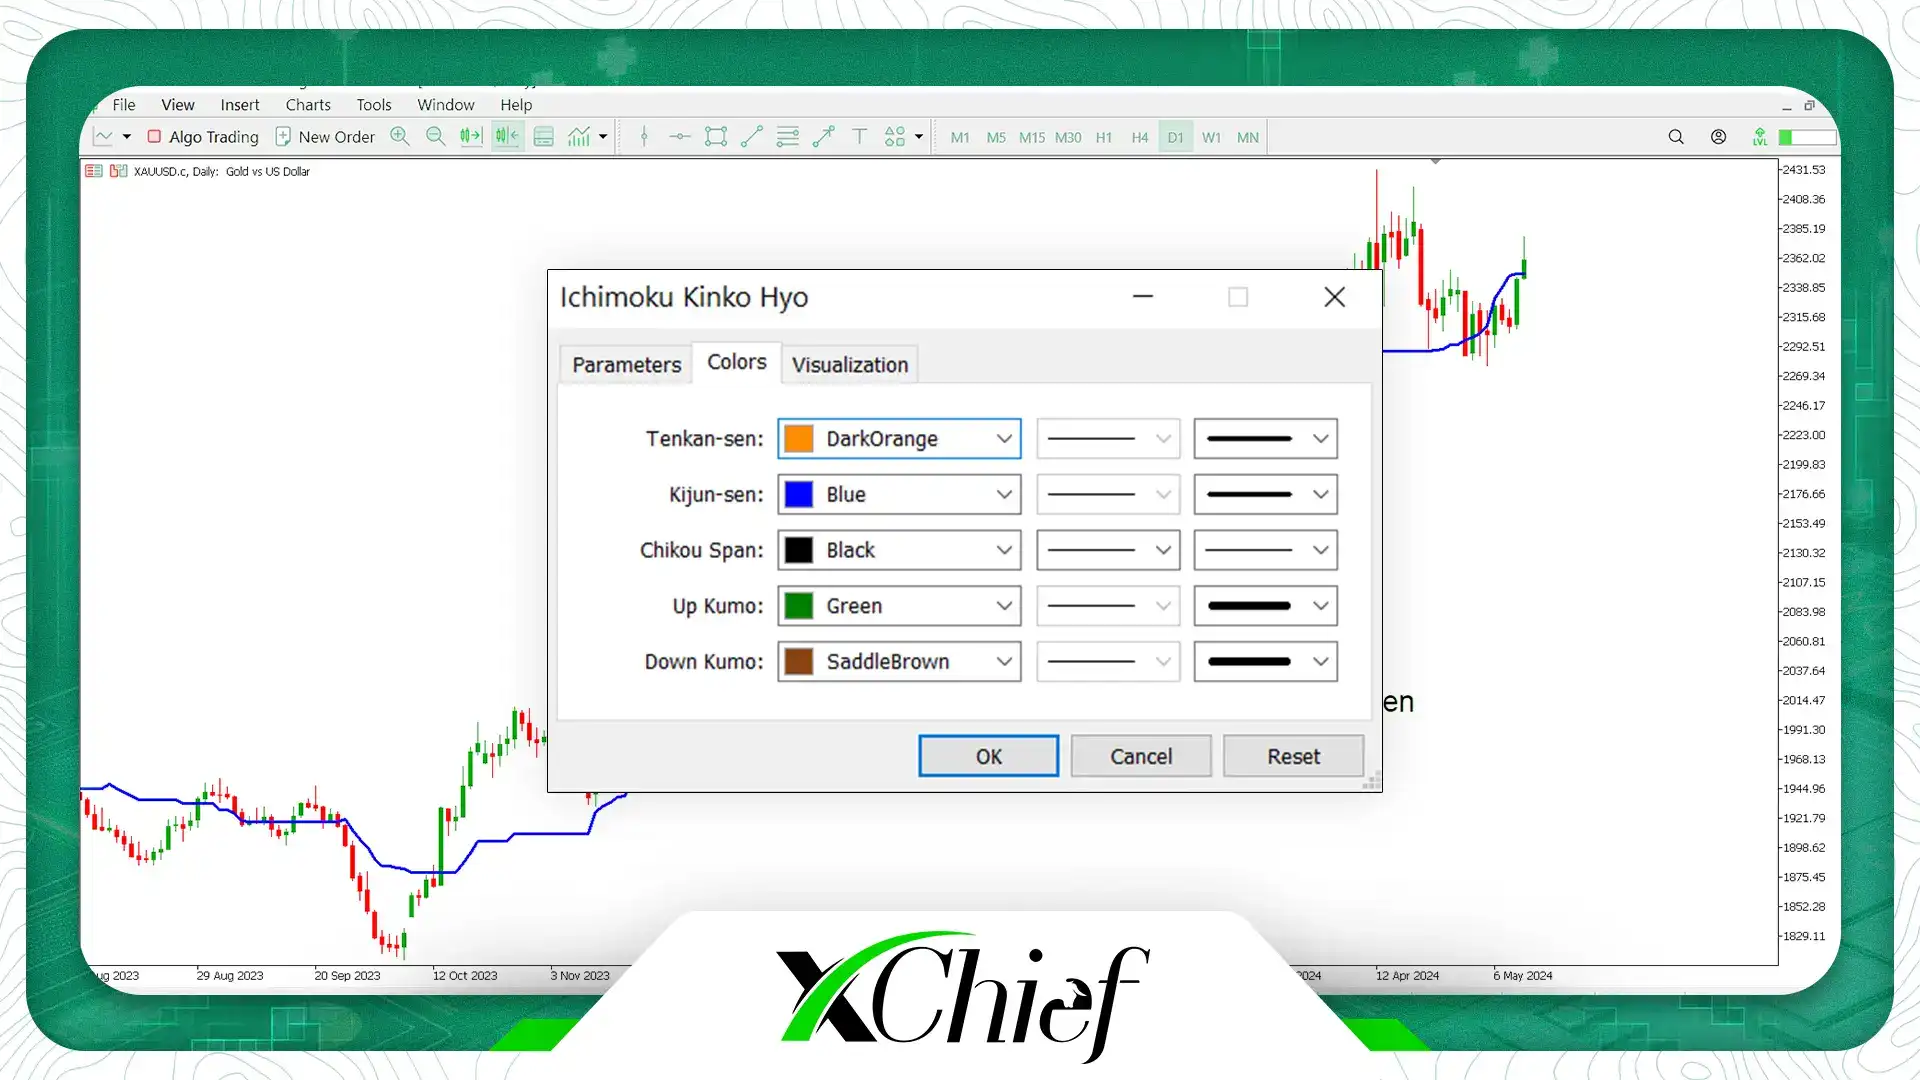
Now, after opening the Ichimoku settings window, apply the following settings and click on the OK option to better see the Ichimoku components.
- Tenkan Sen: orange color , thickness 3
- Kijun Sen: blue color , thickness 3
- Chikou Span: black color , thickness 1
- Up Kumo: green color , thickness 5
- Down Kumo: brown color , thickness 5
What is the unique feature of Ichimoku?
One of the unique features of Ichimoku compared to other existing indicators is its ability to be used to predict the future. In fact, Ichimoku helps you to determine the support and resistance levels of the future market trend according to the relative position of the price. It is precisely for this reason that Ichimoku has become very popular among traders and traders in various markets. Ichimoku is so popular that some consider it not an indicator, but a complete trading style, believing that with Ichimoku, you don’t need any other tool. However, do not forget that using this indicator alone can have a significant risk; For this reason, professional traders use it along with other indicators for a better result. For example, you can use the Ichimoku along with the RSI indicator to determine the price movement.
Ichimoku difference with moving averages
You may imagine that since Ichimoku is the result of the average price values in different periods, then it is the same as the normal moving average (Moving Origin); But these two concepts have serious differences. Although Ichimoku and moving averages are both technical analysis tools used to identify trends and support and resistance levels in a price chart, there are key differences between them. for example:
- Moving averages simply calculate the average price over a specific time period (such as 20 days or 50 days).
- The Ichimoku indicator uses several specific moving averages, along with price prediction levels and the Kumo cloud.
- A moving average is a relatively simple indicator that is easy to understand and use.
- The Ichimoku indicator is a complex indicator whose interpretation requires a complete understanding of its components.
Ichimoku indicator trading strategies
Do you want to make a good profit from Ichimoku? It is best to use proven and comfortable strategies for this task. In the following, we will introduce the top 2 strategies of Ichimoku.
Tenkansen and Kijonsen cross strategy
Cross Tenkansen and Kijonsen strategy is one of the popular technical analysis methods in the Ichimoku indicator, which is used to identify buying and selling opportunities in financial markets. This strategy is based on the intersection of two key lines Tenkansen and Kijonsen. According to this strategy, if Tenkansen is bullish and crosses Kijonsen in the same situation, this situation can be considered as a buy signal. It should be noted that if the Tenkansen and Kijonsen cross occurs above the cloud, the buy signal will be stronger. But if the Tenkansen and Kijonsen cross occurs in the cloud, the buy signal will not have much power and there will be a possibility of losing in the transaction. All these conditions are also true for the descending mode. In this method, the loss limit is always set a little further than Kijonsen.
Cross Keygensen strategy and price
This strategy is based on the price position relative to the Kijonsen line. According to this strategy, if the price is bullish and crosses Kijonsen in the same situation, this situation can be considered as a buy signal. It should be noted that if the price and Kijonsen cross occurs above the cloud, the buy signal will be stronger. But if this cross occurs in the cloud, the buy signal will not have much power and there will be a possibility of losing in the transaction. All these conditions are also true for the descending mode. In this method, the loss limit is always set a little further than Kijonsen.
Disadvantages of Ichimoku at a glance
So far we have talked about the benefits and unique features of Ichimoku. Since in the financial markets, no method and tool is always and absolutely profitable, so it is reasonable to examine the disadvantages of this Japanese indicator:
One of the disadvantages of Ichimoku is that its performance is based on past price information. Past data and events may not always be in a recurring cycle and therefore cannot be relied upon to analyze future market trends. Therefore, Ichimoku, like other technical analysis tools, can provide you with incorrect information and it is essential that you always follow risk management. To increase your productivity, you can use Ichimoku along with other tools such as Fibonacci or support and resistance lines. In the table below, you can see the advantages and disadvantages of the Ichimoku indicator side by side:
| Advantages | Disadvantages |
| Completeness: Ichimoku provides comprehensive information on trends, support and resistance levels, and buy and sell signals. | Complexity: Ichimoku can be difficult for novice traders to fully understand and interpret. |
| Adaptability: Ichimoku can be used in a wide variety of markets and financial instruments. | Lag: Ichimoku signals are based on past prices and may be late to indicate changes in the market. |
| Objective: Ichimoku is based on mathematical calculations and is not interpreted subjectively. | Too much information: The amount of information provided by Ichimoku can be overwhelming and confusing for some traders. |
| Powerful: Ichimoku can be effective in identifying strong trends and potential entry and exit points. | Inconclusive: No indicator is completely reliable and Ichimoku signals can be false. |
| Visual: Graphical representation of Ichimoku can make it easier to understand trends and key levels. | Need for confirmation: Ichimoku signals need to be confirmed with other indicators and analysis. |
final word
The Ichimoku indicator is a powerful and comprehensive technical analysis tool that can help traders identify profitable trading opportunities. However, keep in mind that no indicator is perfect and Ichimoku is no exception. To use this indicator effectively, it is necessary to fully understand how it works and interpret its signals. You should also use Ichimoku along with other indicators and analysis methods to get a more comprehensive view of the market.
In your opinion, is the Ichimoku indicator as popular as it is? Is it really efficient and useful? What indicators can be used next to this Ichimoku? Please share your opinion with us below this article.
Frequently Asked Questions
1. What is the Ichimoku indicator?
Ichimoku is a comprehensive technical analysis indicator that provides comprehensive information on trends, support and resistance levels, and buy and sell signals. This indicator consists of several lines and clouds that are drawn based on mathematical calculations and past prices.
2. What are the advantages of using the Ichimoku indicator?
Among the advantages of Ichimoku can be mentioned its versatility, high adaptability and accuracy.
3. What are the disadvantages of using the Ichimoku indicator?
Disadvantages of Ichimoku include complexity, delay, large amount of information and need for other confirmations.
4. How to use the Ichimoku indicator in trading?
Ichimoku can be used to identify trends, support and resistance levels, and buy and sell signals. To interpret Ichimoku signals, you need to pay attention to the position of the lines and its cloud relative to the price. You should also use Ichimoku along with other indicators and analysis methods to get a more comprehensive view of the market.