What is the Trendline in technical analysis?

Undoubtedly, all people who have invested in the financial markets would like to get the best results from this platform. To have high profit and timely decisions, the main priority is to know the market trend. In technical analysis, one of the most important tools for analyzing and checking the market trend is the use of the Trendline. The Trendline in technical analysis allows traders to check the market situation and prices and make the right decisions. In this article from xChief Academy, we intend to fully examine the Trendline in technical analysis. Stay with us.
Table of Contents
- What is the Trendline in technical analysis?
- Types of Trendlines in the forex market
- How to draw a Trendline in technical analysis
- Advantages and disadvantages of Trendline in forex
- strategies with Trendline in technical analysis
- Final word
- Frequently Asked Questions
What is the Trendline in technical analysis?
In technical analysis, the Trendline is a graphic line that expresses the general trend of the price of a financial asset. This line is usually placed on the price chart and shows the direction of movement and behavior of the price. If the Trendline is inclined upwards, it indicates the upward trend and the growth of the price rate. By properly examining this trend, you can notice price fluctuations. If the trend line is inclined downward, it indicates a downward trend and a decrease in the price rate. The main trend of the chart can be recognized from the overall result of the upward and downward movements.
Types of Trendlines in the forex market
There are different types of Trendline. Examining each Trendline’s behavior can inform you about the price situation. To better master the Trendline in technical analysis, you should be familiar with its types. In technical analysis, the Trendline is divided into the following three main categories:
- Uptrend Line
- Downtrend Line
- Fixed or horizontal Trendline (Horizontal Line)
Uptrend Line
As its name suggests, the Uptrend Line is considered for a rising market. From a technical point of view, the market has three general modes, which are:
- Uptrend
- Downtrend
- Turbulent market or Range
In this view, a rising market is said to be a situation where we have higher ceilings and floors than each other. In a bull market, corrective movements are bearish but short and temporary. Likewise, a bear market is said to be a situation where we have lower ceilings and floors than each other. In a bear market, corrective movements are upward but short and temporary. Market turbulent or Range is a state in which the ceilings are not higher than each other and the market only fluctuates between two horizontal levels. Although these definitions have a simple meaning, they form the basis of all styles of technical analysis and you cannot become a successful market trader without understanding this concept. Now that you are familiar with the concept of a rising market, let’s look at the rising Trendline!
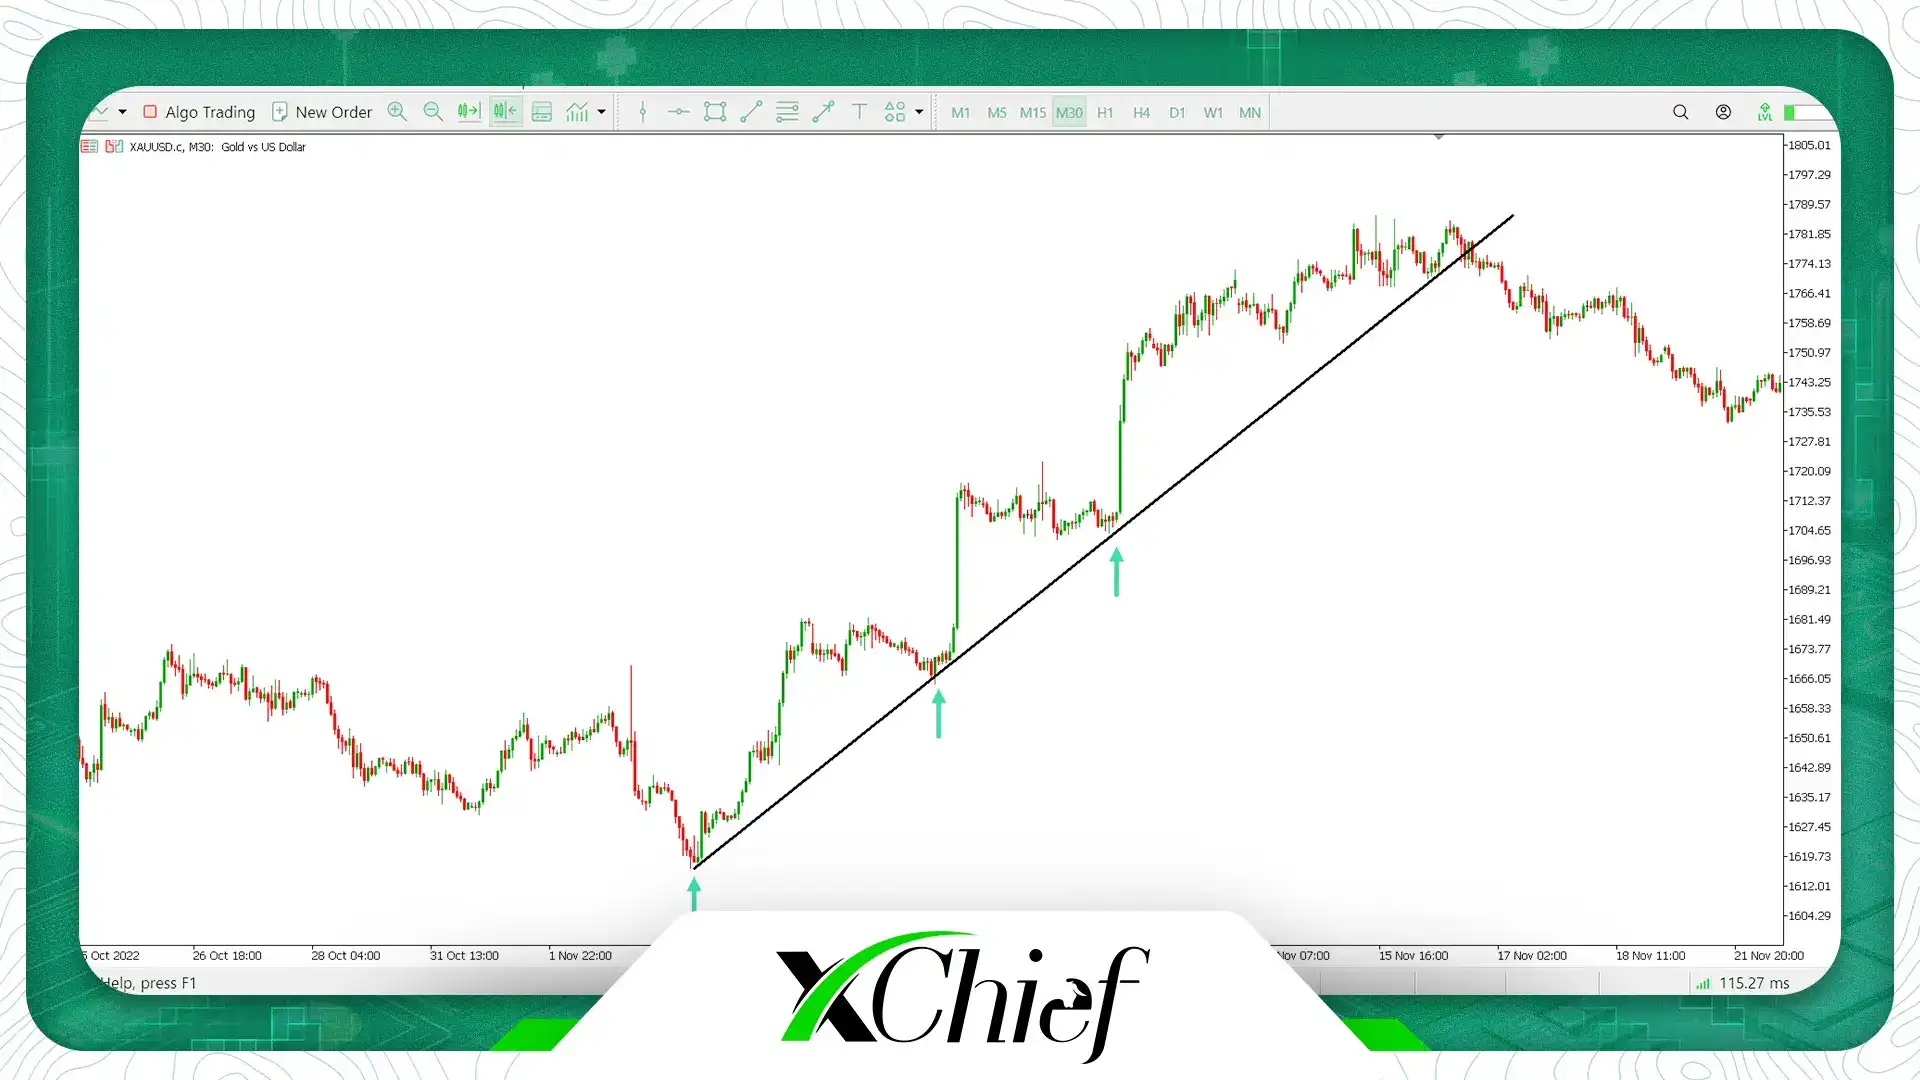
The upward Trendline is a diagonal line that is drawn in an upward trend along the minimum of two bottoms (the last points of corrective movements). After drawing the upward Trendline, it is expected that in the future, when the market is in a corrective movement and reaches along the Trendline, the correction will end and the new upward movement will start again. For the third assurance, it is recommended to use only Trendlines drawn from at least 3 points. For example, in the image below, you can see an uptrend line of the global gold symbol (XAUUSD):
Downtrend Line
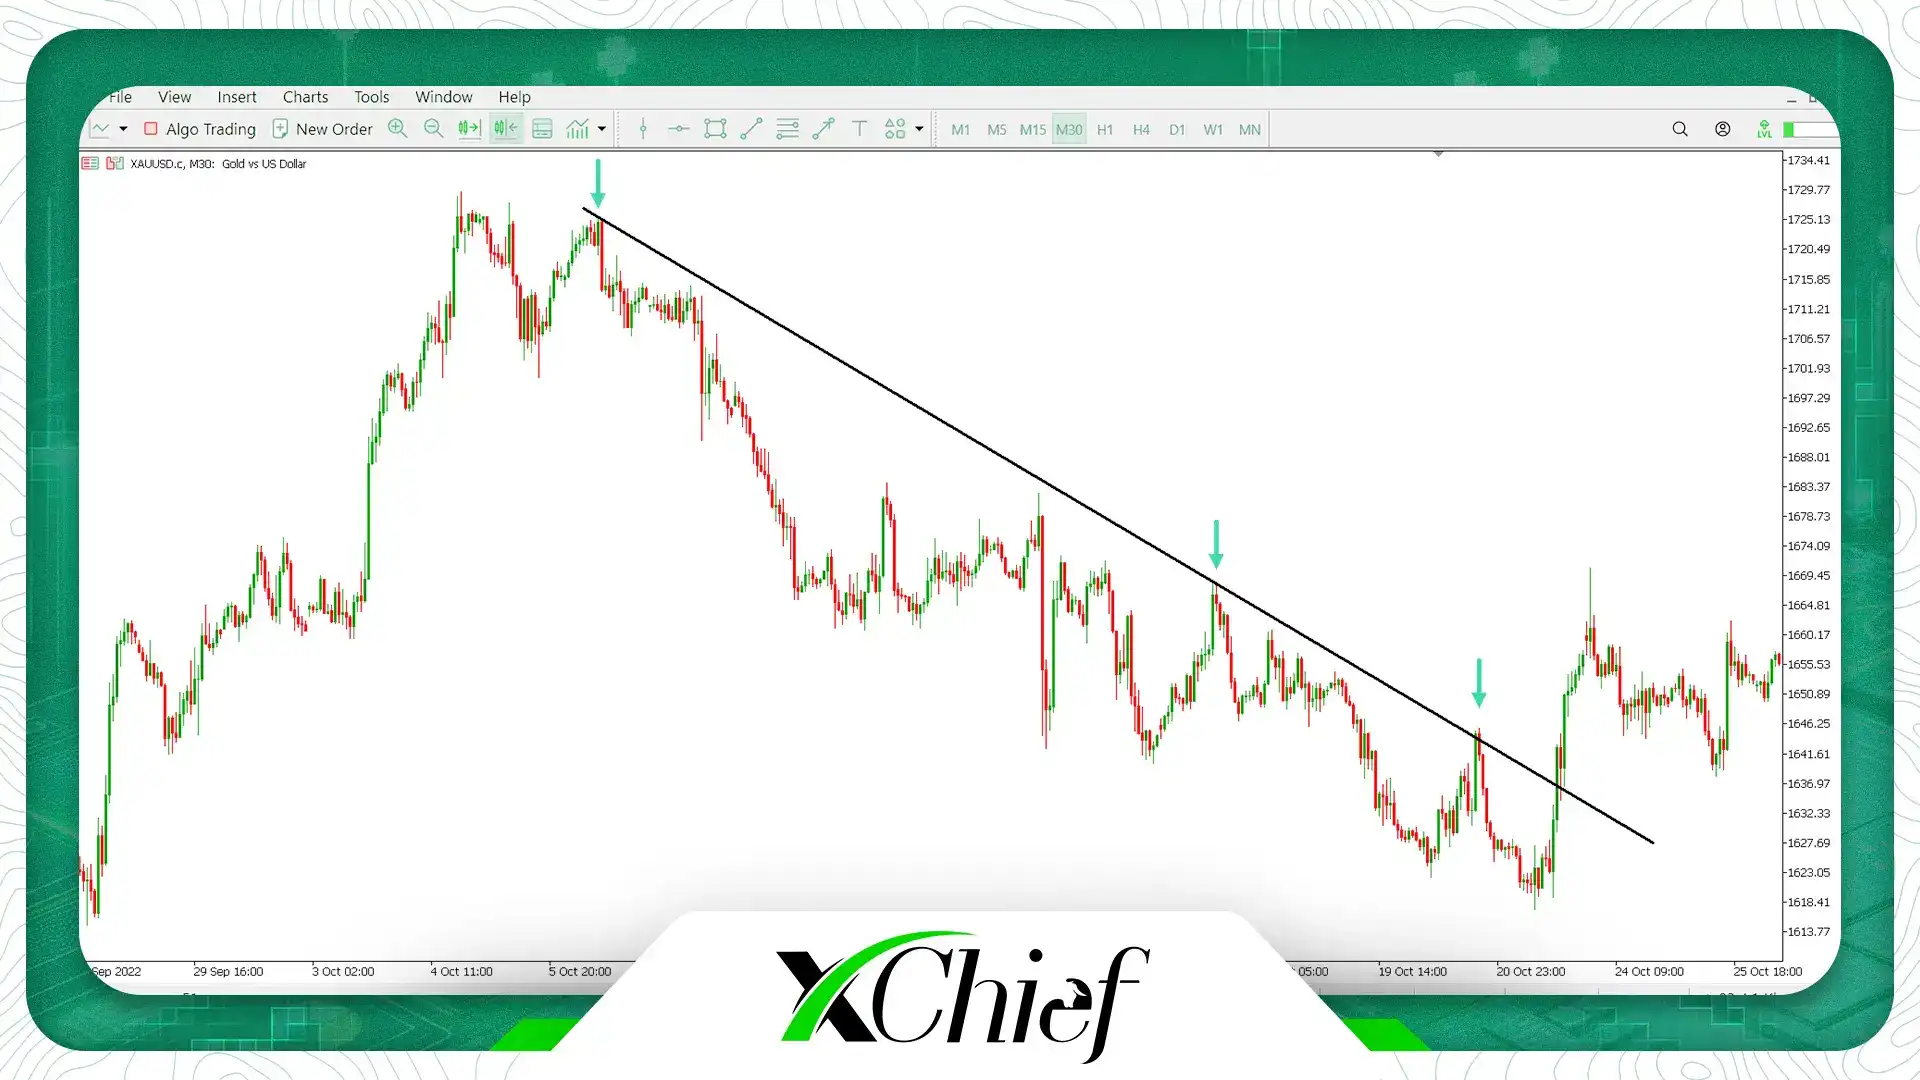
A downward Trendline is a diagonal line that is drawn in a downward trend along at least two ceilings (the last points of corrective movements). After drawing the downward Trendline, it is expected that in the future, when the market is in a corrective movement and reaches along the Trendline, the correction will end and the new downward movement will start again. For the third assurance, it is recommended to use only trend lines drawn from at least 3 points. For example, in the image below, you can see a downtrend line of the global gold symbol (XAUUSD):
Fixed or horizontal Trendline (Horizontal Line)
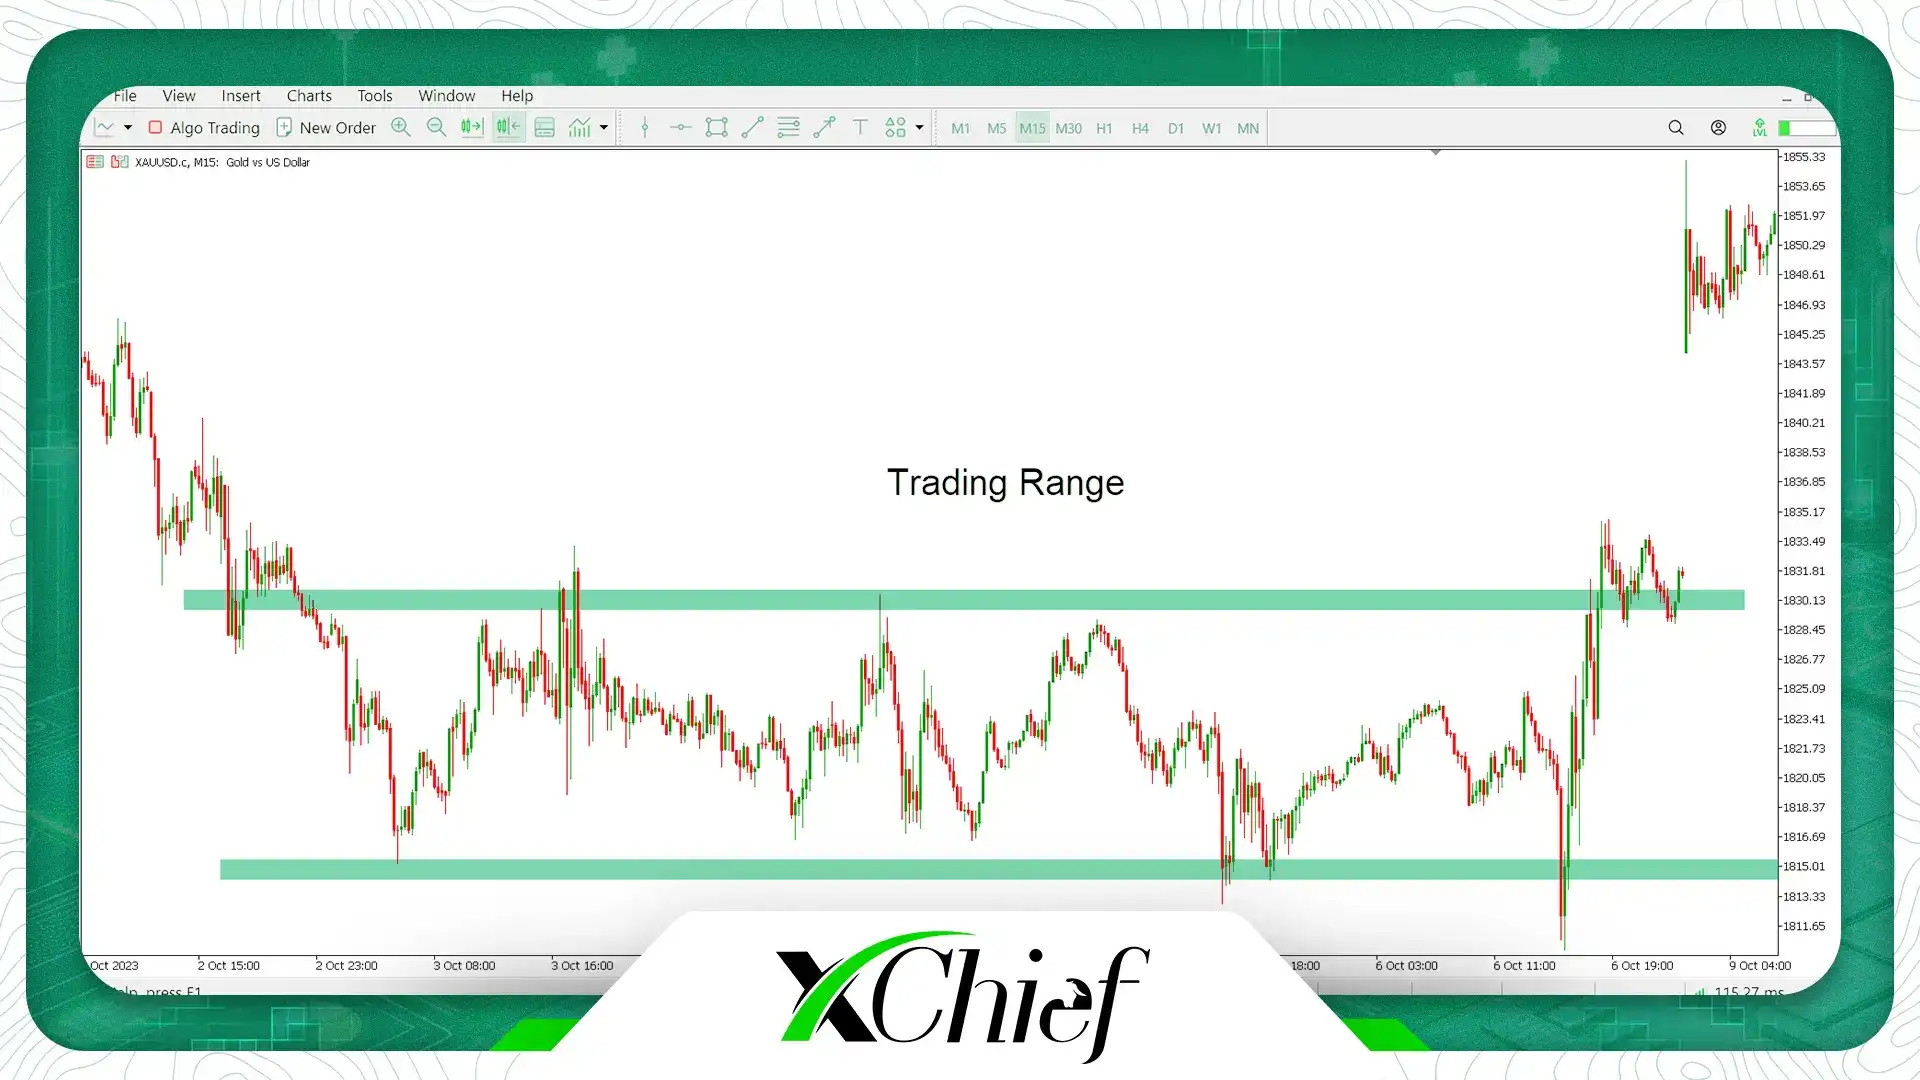
The horizontal line, which is also known as support and resistance levels, is drawn when the market is in range and the ceilings are almost equal to the floors in the market. In fact, in this case, the market only fluctuates between two horizontal levels, and the power of buyers and sellers is almost equal. For example, in the image below, you can see the suffering or turbulent market of the global gold symbol (XAUUSD). This trading range continued until the end of the week, until the news of the war between Russia and Ukraine was published over the weekend and the gold market opened the new week with a significant gap.
How to draw a Trendline in technical analysis
Undoubtedly, in technical analysis, the Trendline is one of the important tools in order to identify the direction of movement of a chart. To draw a Trendline, you need to look for price points that are in consecutive upswings or downswings. Then connect these points with a straight line. The steps of drawing the Trendline are as follows:
1. Identifying important points: First, check the trend and identify the important (major) points of the market where the price has rotated.
2. Draw a Trendline: You draw a Trendline by connecting two or more of these key points with a straight line. If the line has a positive slope, it is called an uptrend line, and if the slope is negative, it is a downtrend line.
3. Trendline Confirmation: You can confirm or correct your trendline by continuing the price movement and seeing if the price continues to react to the trendline.
4. Use of other tools: You may need to use other analytical tools such as price patterns or moving averages to enhance the analysis. Once you draw the Trendline correctly, you can use it to predict price movements and make decisions about buying and selling your assets.
Advantages and disadvantages of Trendline in forex
Trendlines, with all their positive points, cannot always provide the right guidance to users and sometimes they are wrong. In the following, we point out some disadvantages and violations of the trend line in technical analysis:
- A trendline may be inconsistent and give incorrect guidance in unfavorable market conditions, such as a bearish market. This can mislead a person and lead to wrong decisions.
- Some experts believe that using the Trendline alone is not enough for market analysis and that other confirmations are needed for successful trading.
- Based on time variables, the trendline may lag and not provide up-to-date information on the direction of market movement.
- Differences in the determination of points depending on the selection of the base points and timing of the trend line may cause ambiguities in the analysis.
Unexpected external factors such as news, political and economic events can have unexpected effects on the market trend that the trendline cannot correctly predict.
The importance of the Trendline in technical analysis
The use of Trendlines is one of the main tools of technical analysis. Trendlines can help identify the direction of price movement and show different patterns. You can also use trendlines along with moving average (MA), support and resistance lines, price channels, etc. for more confidence.
Break the Trendline in technical analysis
Breakout of Trendline generally shows a break or failure in the movement behavior of a financial asset. In technical analysis, none of the trendlines will continue forever and eventually that trendline will be broken. Drawing trendlines based on important price points in the price chart can be used as an important tool to identify market trends and their change points.
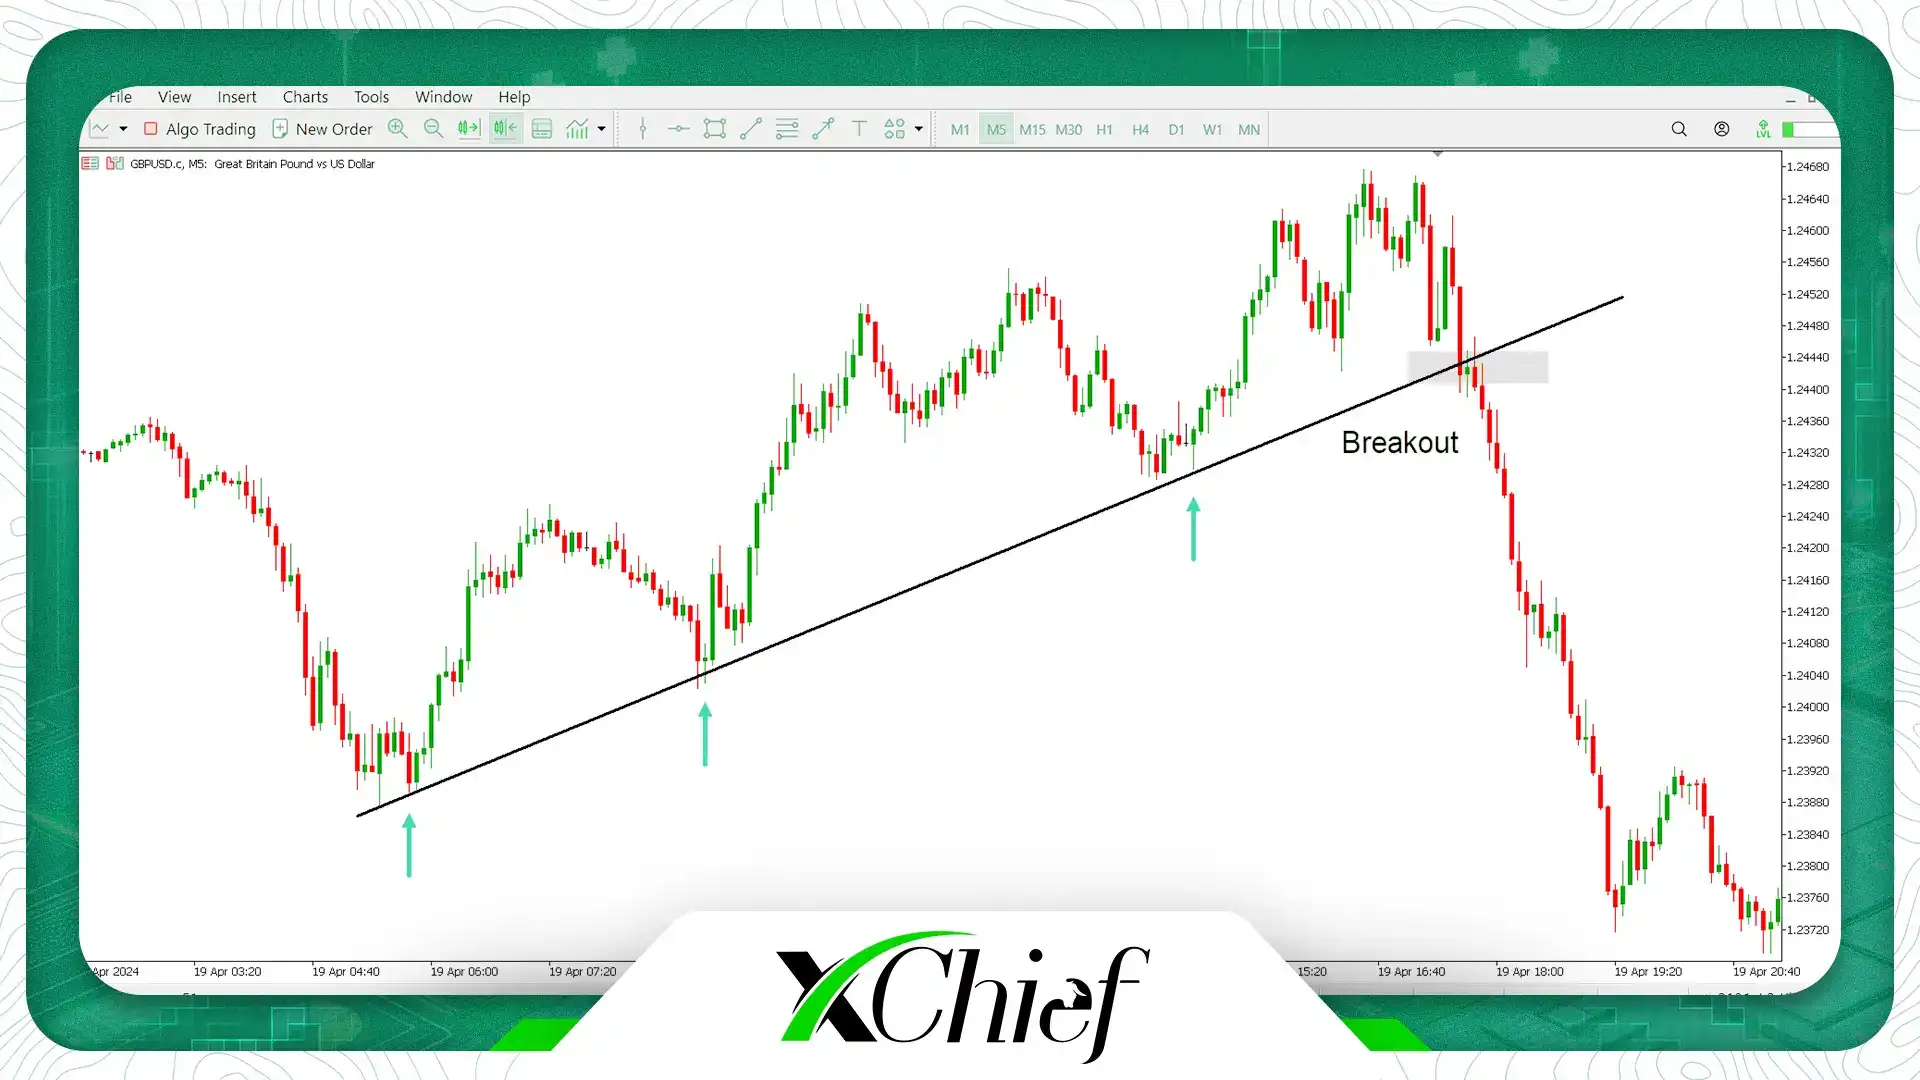
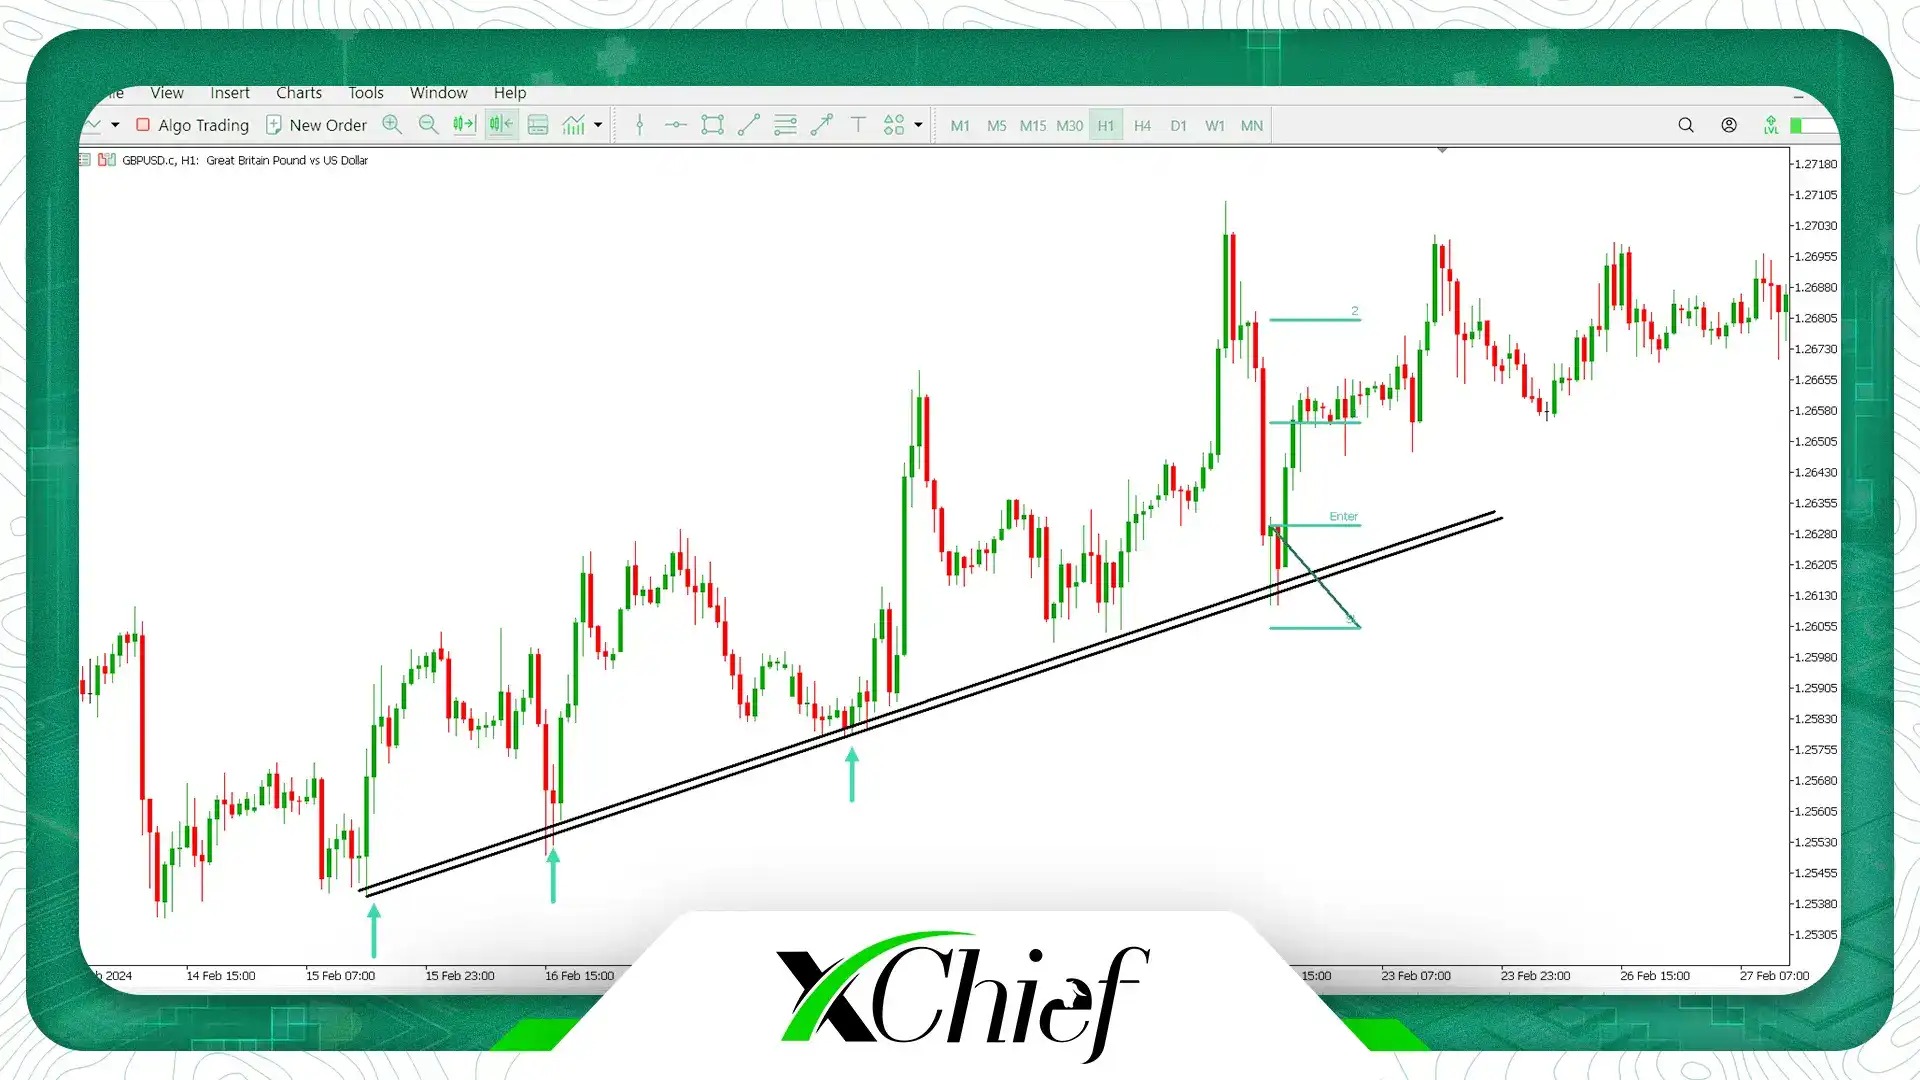
When an asset breaks its uptrend or downtrend line, prices break out of it, which may indicate a change in the direction of the price movement. This breakout can occur horizontally or vertically and is usually accompanied by high trading volume, which indicates that this movement has a greater impact on the market. After a trendline breaks, traders try to enter a trade in the direction of the new trend, usually using technical analysis and other tools. For example, in the image below, you can see an upward Trendline of the GBPUSD currency pair, the price then breaks the trendline and a new downward trend begins with a spike. You could enter a sell position after the trendline breaks in this case, and earn a good profit:
Forex Trendline trading
Trendline trading in technical analysis is one of the important methods to detect the direction of price movement in financial markets. This method is based on the use of lines on which prices move consecutively, to determine the direction of price movement. In this method, two trend lines are usually shown: an upward trend line (indicating growth in prices) and a downward trend line (indicating a decrease in prices).
When we draw the upward trend line from the bottom to the top, it shows the growth and strength of the market. If the downward trend line is drawn from top to bottom, this indicates the decline and weakness of the market. Technical traders use trend lines to identify entry and exit points, and this method helps them better understand the direction of market movement and price trends.
Trading strategies with Trendline in technical analysis
Trendline trading strategies are very important and effective in technical analysis. The trendline is used as a key tool in financial market trend analysis to detect the direction of price movement. In general, traders use two strategies for their trades based on the trendline. that includes:
- Trade with a back reaction from the trendline
- Trading with trendline breakouts
Trade with a back reaction from the Trendline
In this method, the market trend is determined first and then the trendline is determined, then the trader waits for a back reaction to the trendline and enters the trade in the direction of the trend when the confirmation candle closes. In this method, the loss limit is placed a little further from the confirmation candle and the profit limit is set at least 2 times the loss limit. In the picture, you can see an example of a trade based on a reversal of the trendline in the GBPUSD currency pair:
Trading with Trendline breakouts
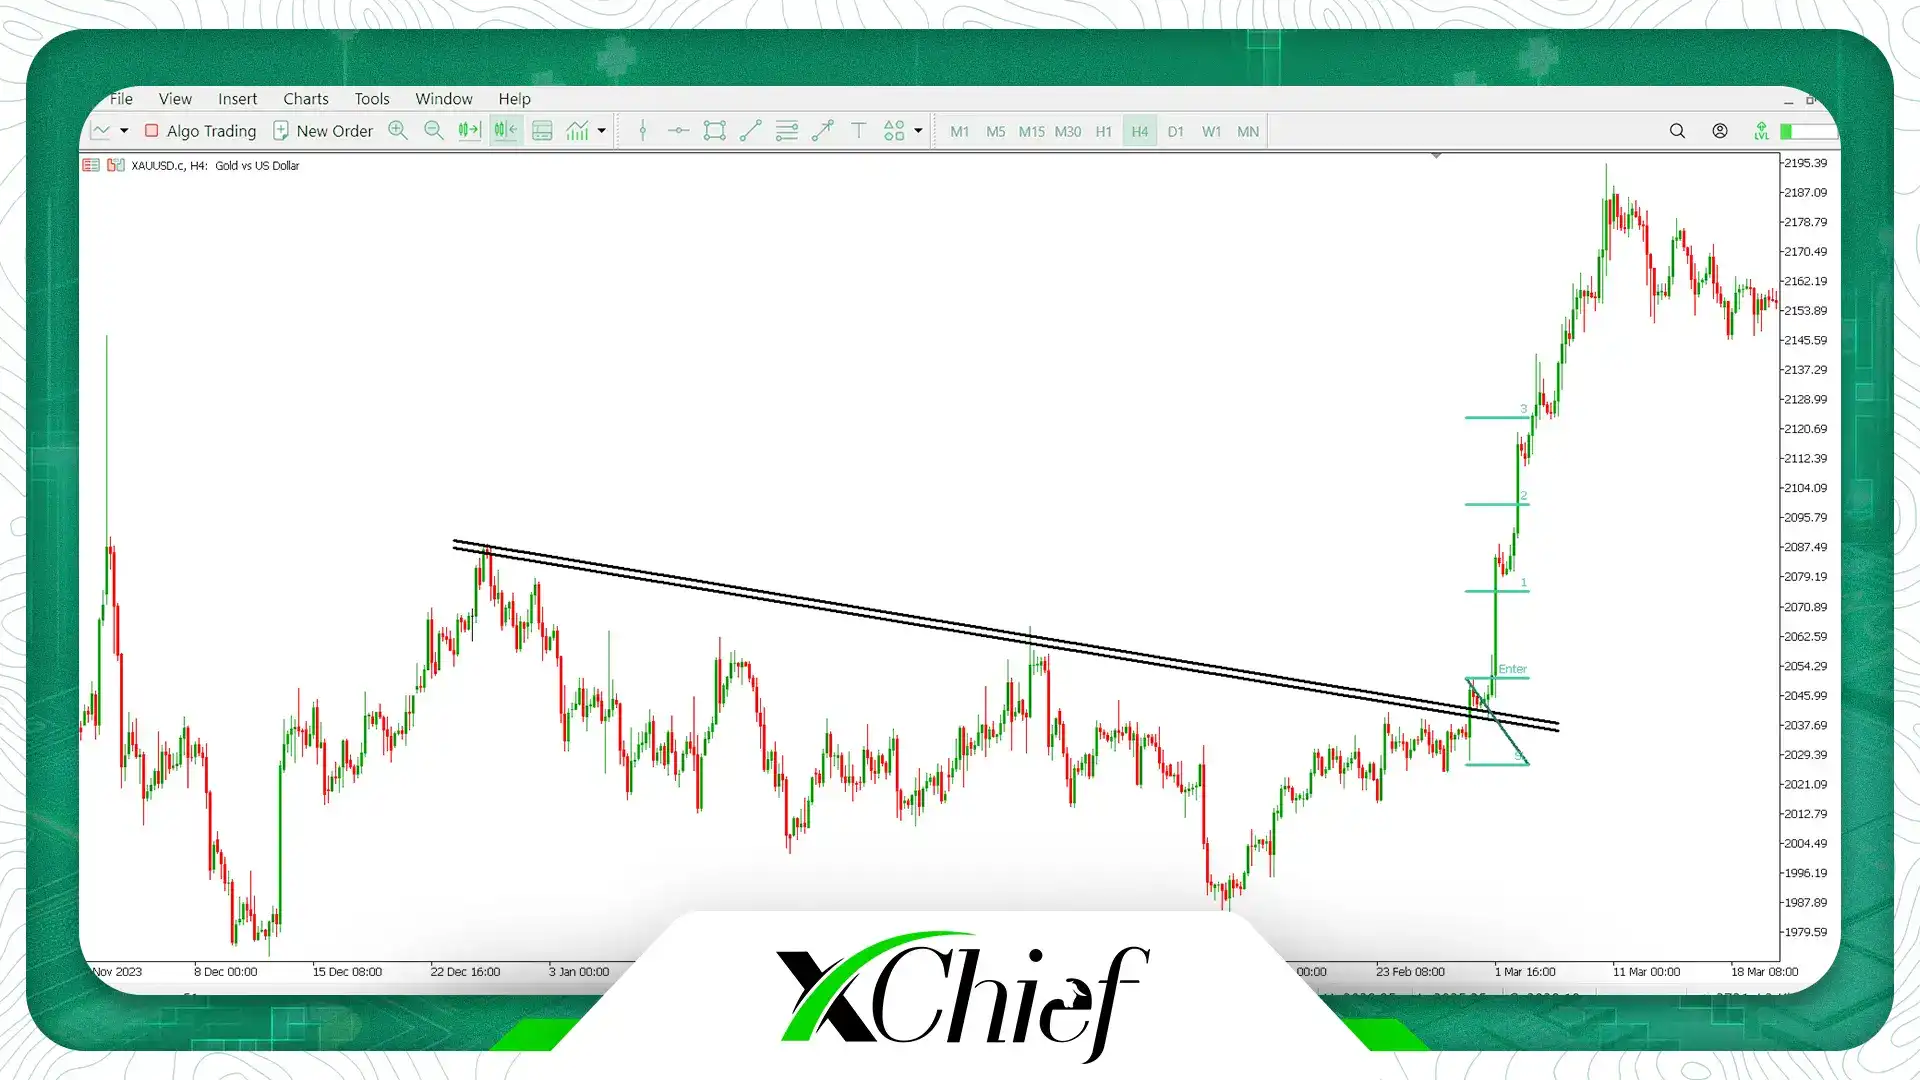
In this method, after breaking the trendline, the trader waits for a pullback and after the last price reaction to the broken trend line, he enters the trade in the direction of the new trend. In this method, the loss limit is placed a little further from the confirmation candle and the profit limit is set at least 2 times the loss limit. In the image, you can see an example of a trade based on a trendline break in the global gold symbol (XAUUSD):
Final word
In this article, we examined the trendline in technical analysis. The trendline in technical analysis is actually price trend analysis which is done by studying price charts and volume of transactions. By viewing and reviewing these charts, traders can learn about the market trend and take appropriate actions. The trendline is mainly divided into 3 ascending, descending and horizontal modes. We hope that the said content has been useful for you.
Frequently Asked Questions
1. What is the trendline?
A trendline is an important tool in technical analysis that shows the direction of market movement over time. The trendline is drawn using the previous prices and plays an important role in knowing the direction of the market trend.
2. How is the trendline drawn?
To draw a trendline, you can use the previous high or low prices and draw a line on the price chart. To show an upward trend, the line is drawn from the bottom to the top, and to show a downward trend, the line is drawn from the top to the bottom.
3. How to use the trendline to make trading decisions?
The trendline can be very effective in making trading decisions and trendlines help traders to trade in the direction of the main market trend and increase the probability of their profits.